ローカルでPrometheusとGrafanaでダッシュボード作成してみる
はじめに
今回は、ローカルでPromethesとGrafana動かし、メトリクスの可視化をしてみたいと思います。
PrometheusとGrafana
Prometheusは、メトリクス管理ツールです。

詳しくは、下記で解説しています。

【監視入門】とりあえず使ってみるPrometheus
はじめに 本記事では、Promethesについてざっくり解説して、実際に簡単な監視をしてみたいと
Grafanaは、データ可視化ツールです。

Prometheusの可視化ツールとしてよく使われています。

Grafana: The open observability platform | Grafana Labs
Grafana is the open source analytics & monitoring solution for every database.
PrometheusとGrafanaの起動
まずは、PrometheusとGrafana、そして監視対象のnode-exporterをDocker Composeで構築します。
docker-compose.yml
docker-compose.ymlは以下の通りです。
1version: '3'
2services:
3  prometheus:
4    image: prom/prometheus
5    volumes:
6      - ./prometheus.yml:/etc/prometheus/prometheus.yml
7    ports:
8      - '9090:9090'
9  grafana:
10    image: grafana/grafana
11    ports:
12      - "3000:3000"
13  node-exporter:
14    image: quay.io/prometheus/node-exporter
15    ports:
16      - 9100:9100
17    volumes:
18      - ./proc:/host/proc
19      - ./sys:/host/sys
20      - ./rootfs:/rootfs
prometheus.yml
また、Prometheusの設定ファイルであるprometheus.ymlも作成します。
node-exporterのIPアドレスはローカルPCのIPアドレスになるので、ifconfigなどでIPアドレスを調べて追記してください。PrometheusからみるとlocalhostはPrometheus自身になるので、node-exporterのIPアドレスをlocalhostにすると通信できないので注意してください。
1global:
2  scrape_interval: 15s
3  external_labels:
4    monitor: 'codelab-monitor'
5scrape_configs:
6  - job_name: 'node'
7    scrape_interval: 5s
8    static_configs:
9      - targets: ['<PCのIPアドレス>:9100']
コンテナ起動
必要なファイルは以上なので、コンテナを起動します。
1docker-compose up -dGrafanaにログイン
http://localhost:3000からGrafanaにアクセスできます。
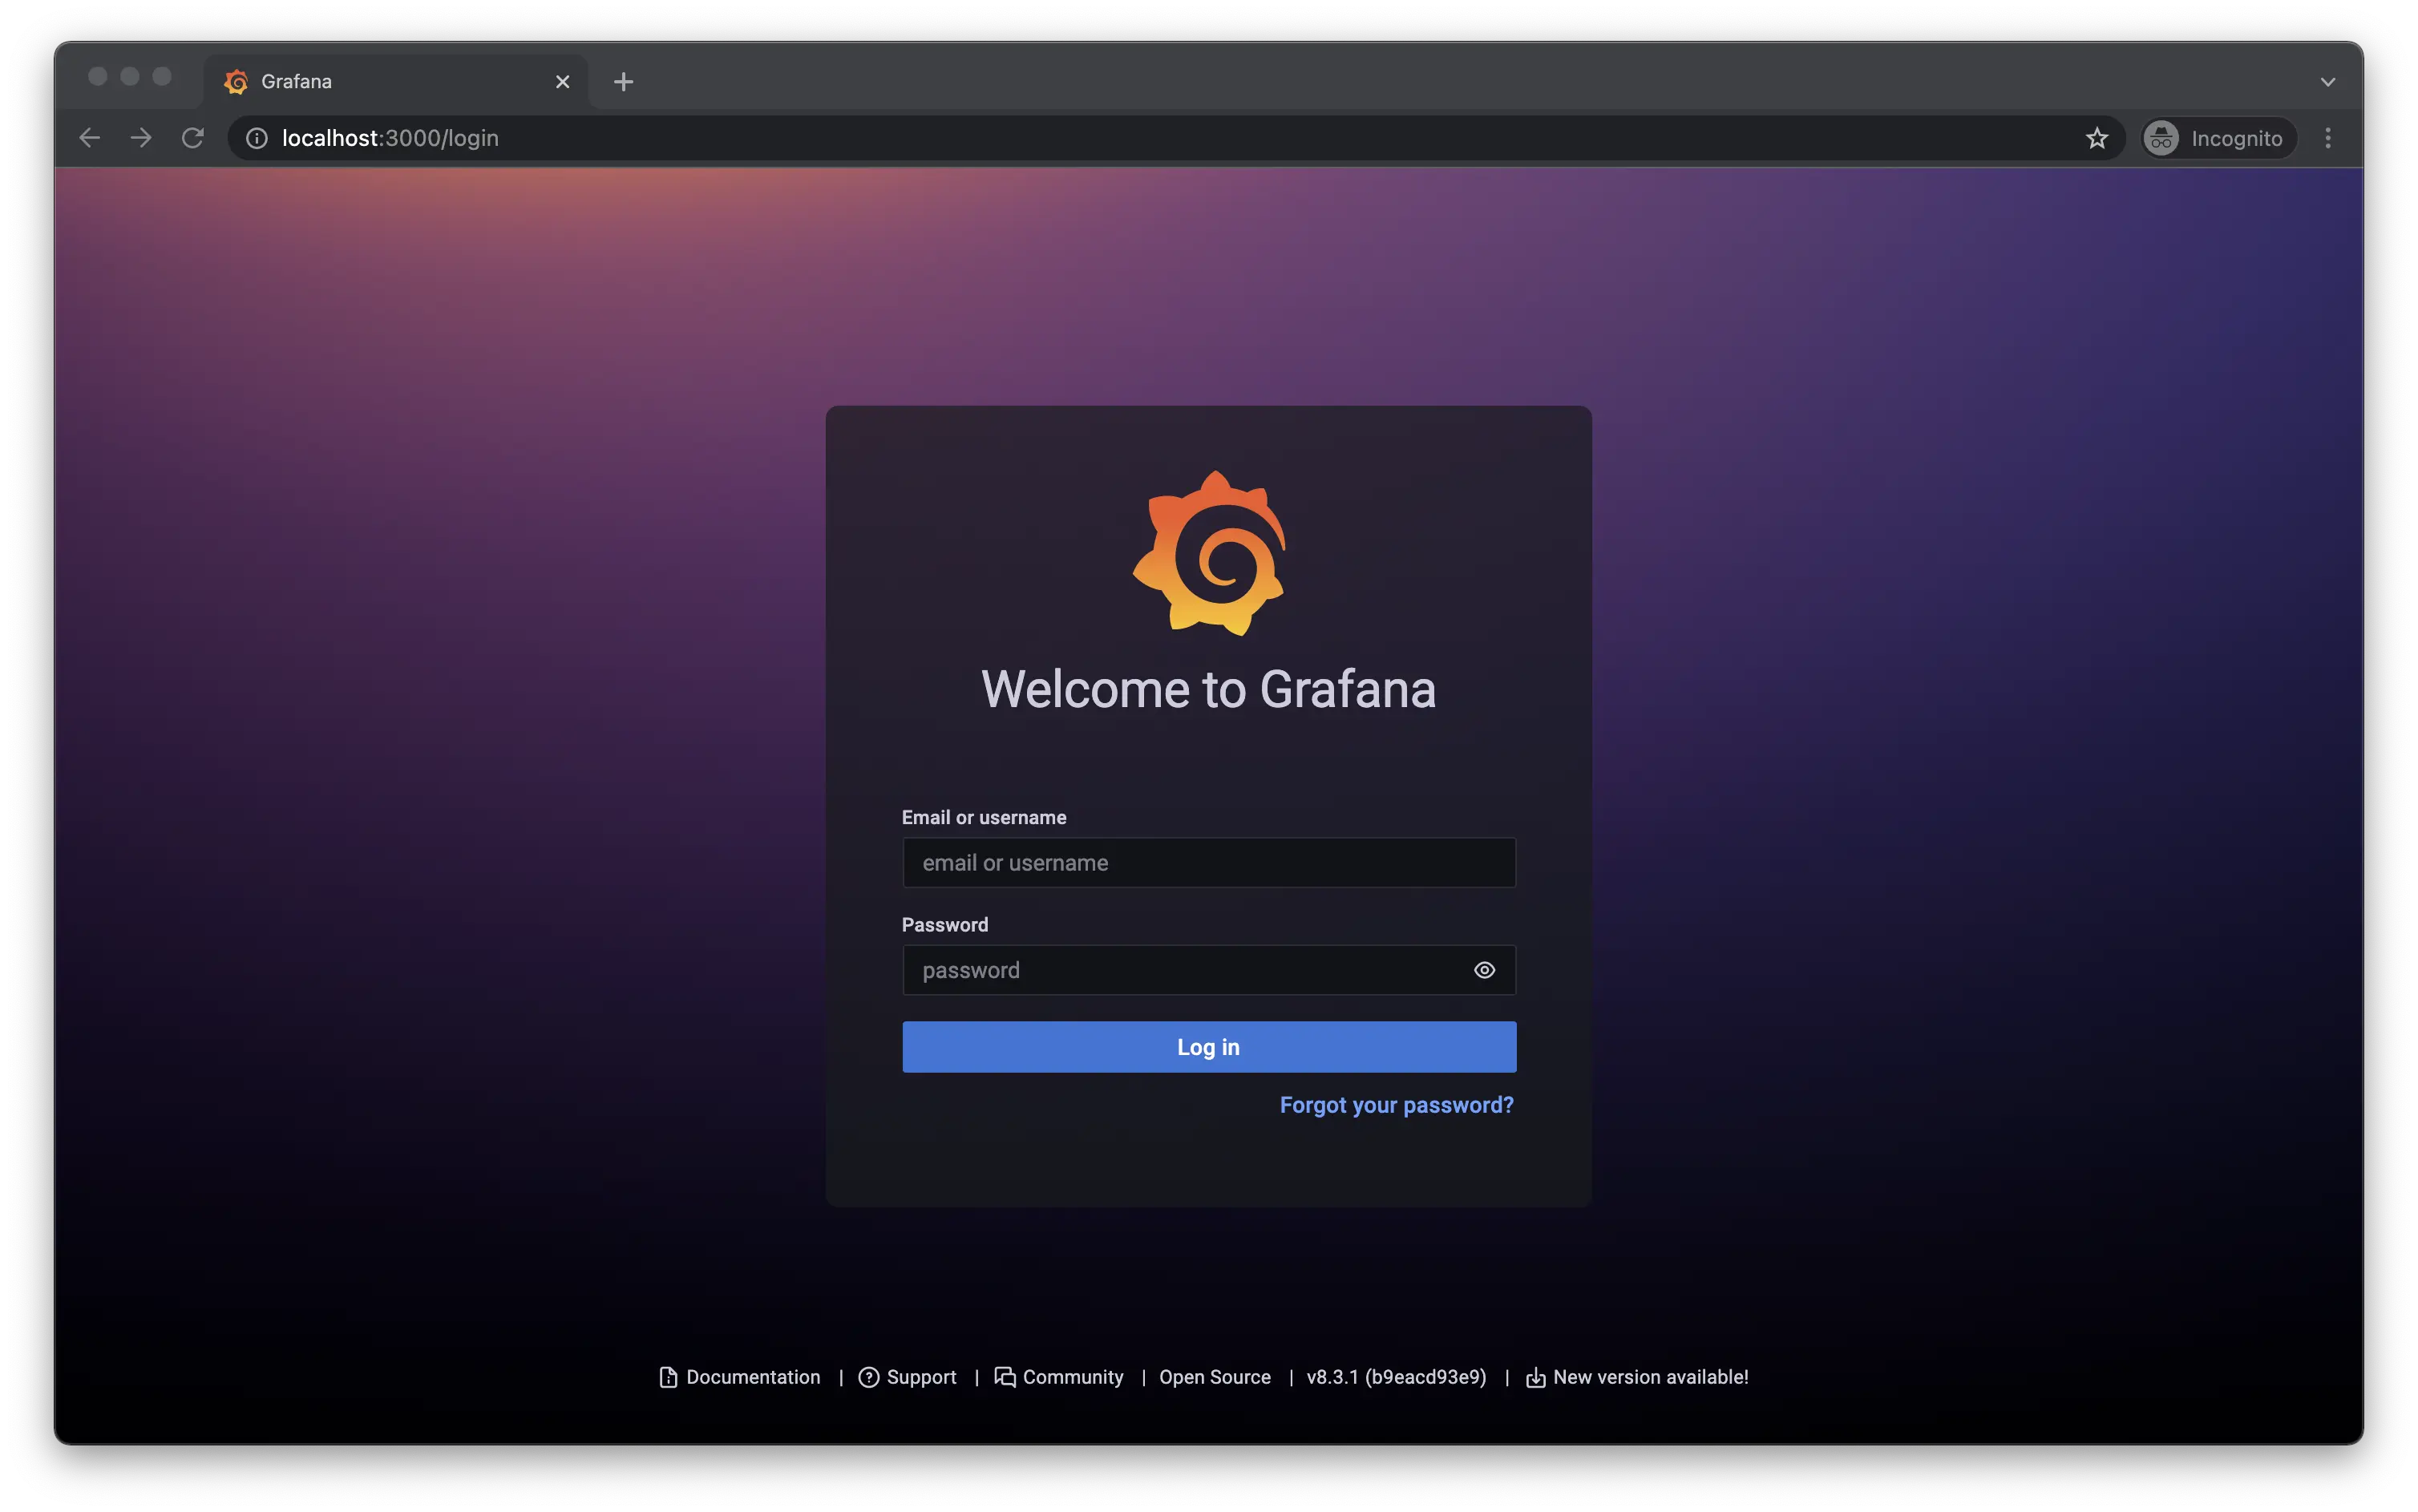
初回は下記でログインすることができます。
- Username: admin
- Password: admin
データソースの設定
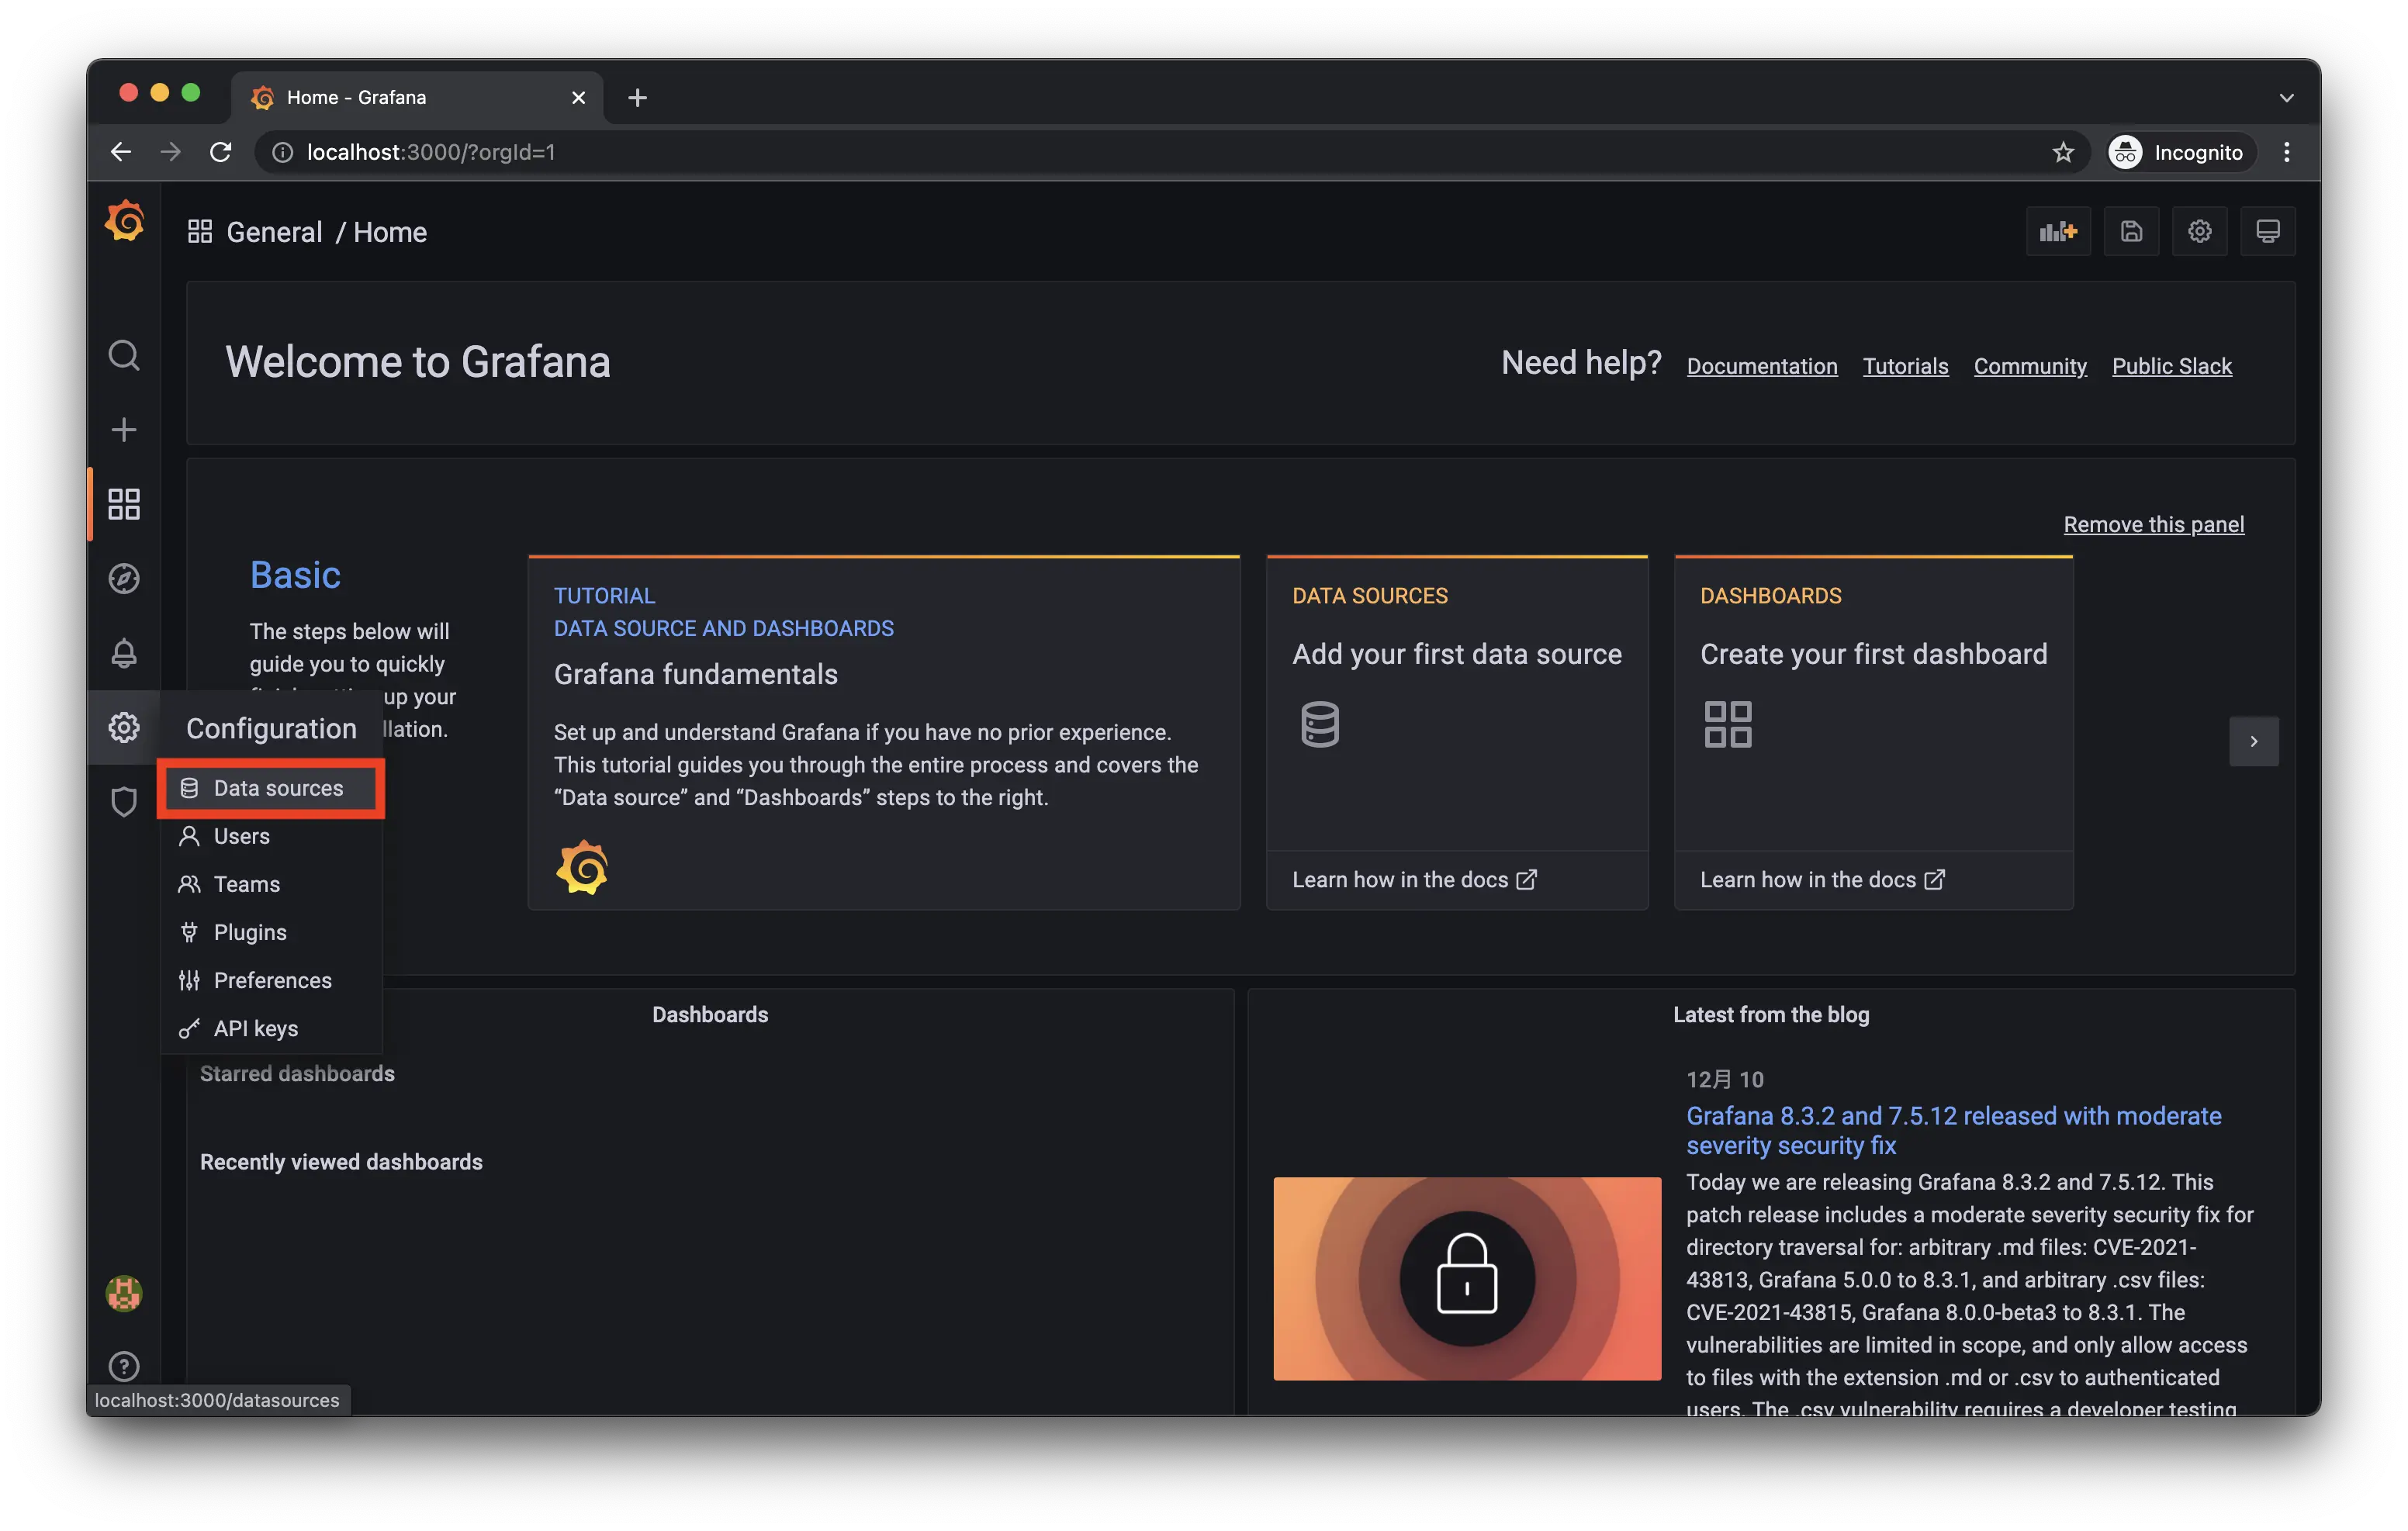
ログインができたらデータソースの設定をします。
「Data Source」をクリックします。
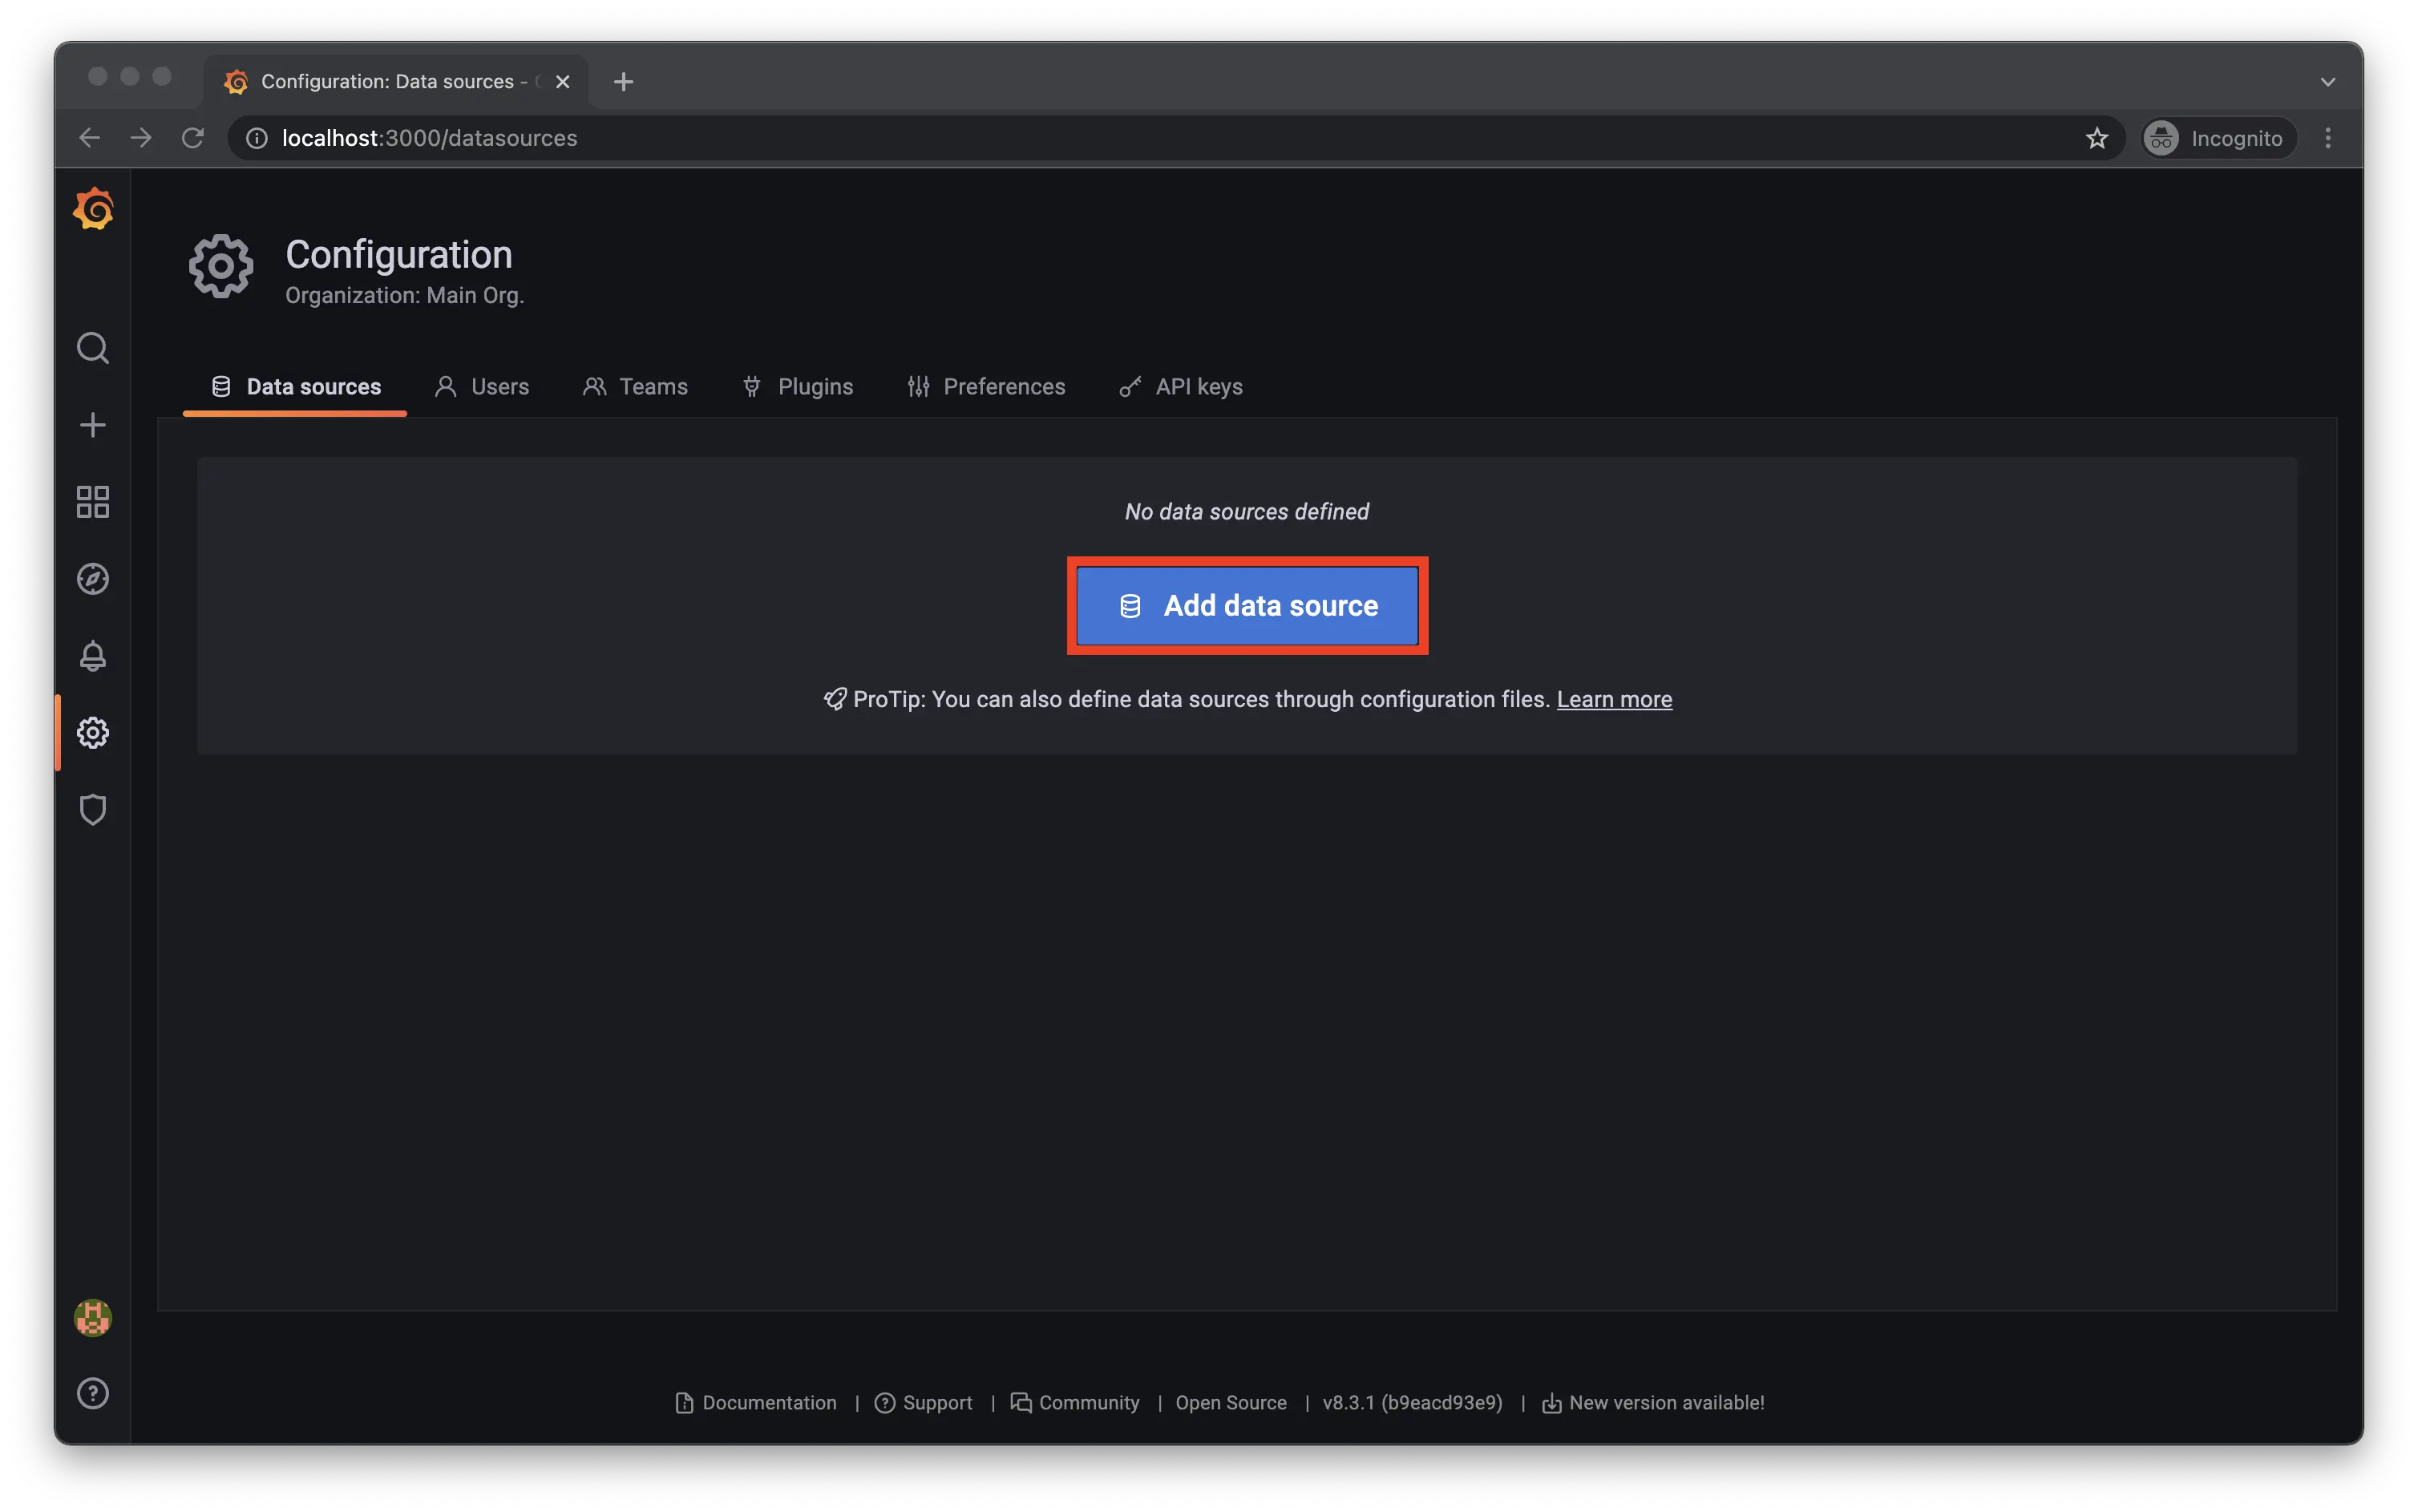
「Add data source」をクリックします。
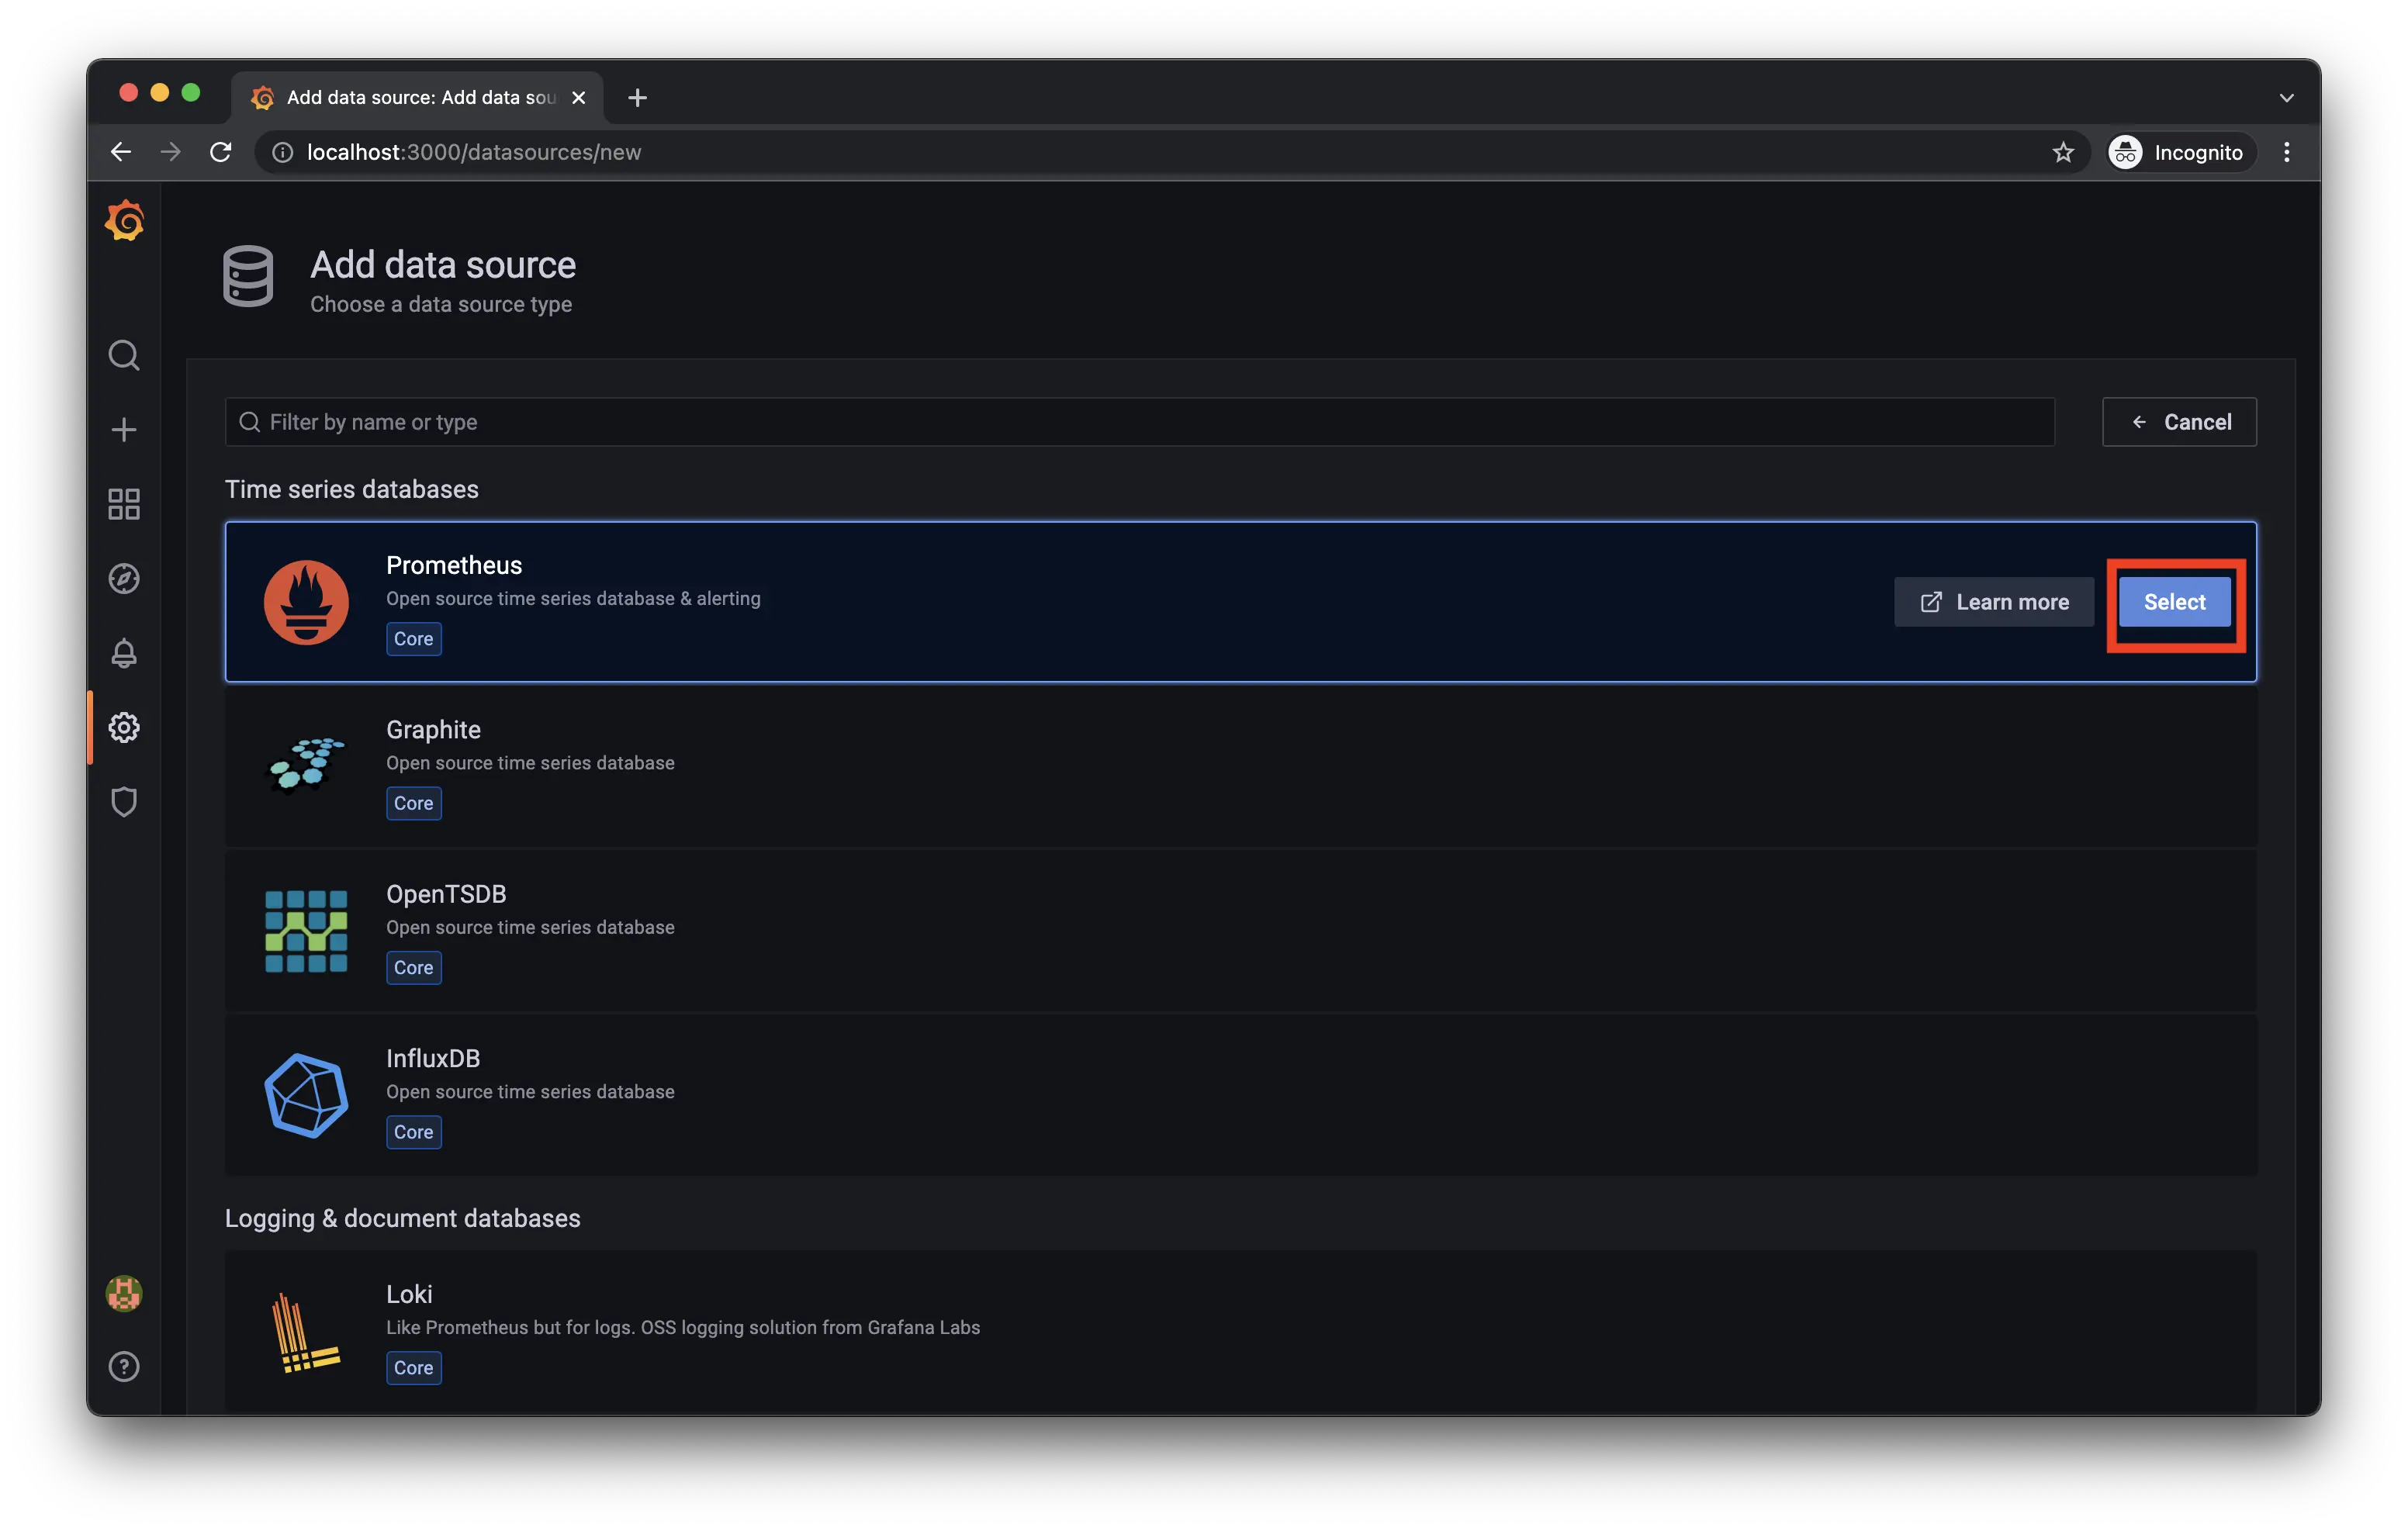
データソースの中からPrometheusを選択します。
PrometheusのURLを設定します。
URLとするのは、docker-compose psで確認できるPrometheusの名前を使用します。下記の場合は、http://prometheus-grafana-sample_prometheus_1:9090になります。
1❯ docker-compose ps
2NAME                                        COMMAND                  SERVICE             STATUS              PORTS
3prometheus-grafana-sample_grafana_1         "/run.sh"                grafana             running             0.0.0.0:3000->3000/tcp
4prometheus-grafana-sample_node-exporter_1   "/bin/node_exporter"     node-exporter       running             0.0.0.0:9100->9100/tcp
5prometheus-grafana-sample_prometheus_1      "/bin/prometheus --c…"   prometheus          running             0.0.0.0:9090->9090/tcp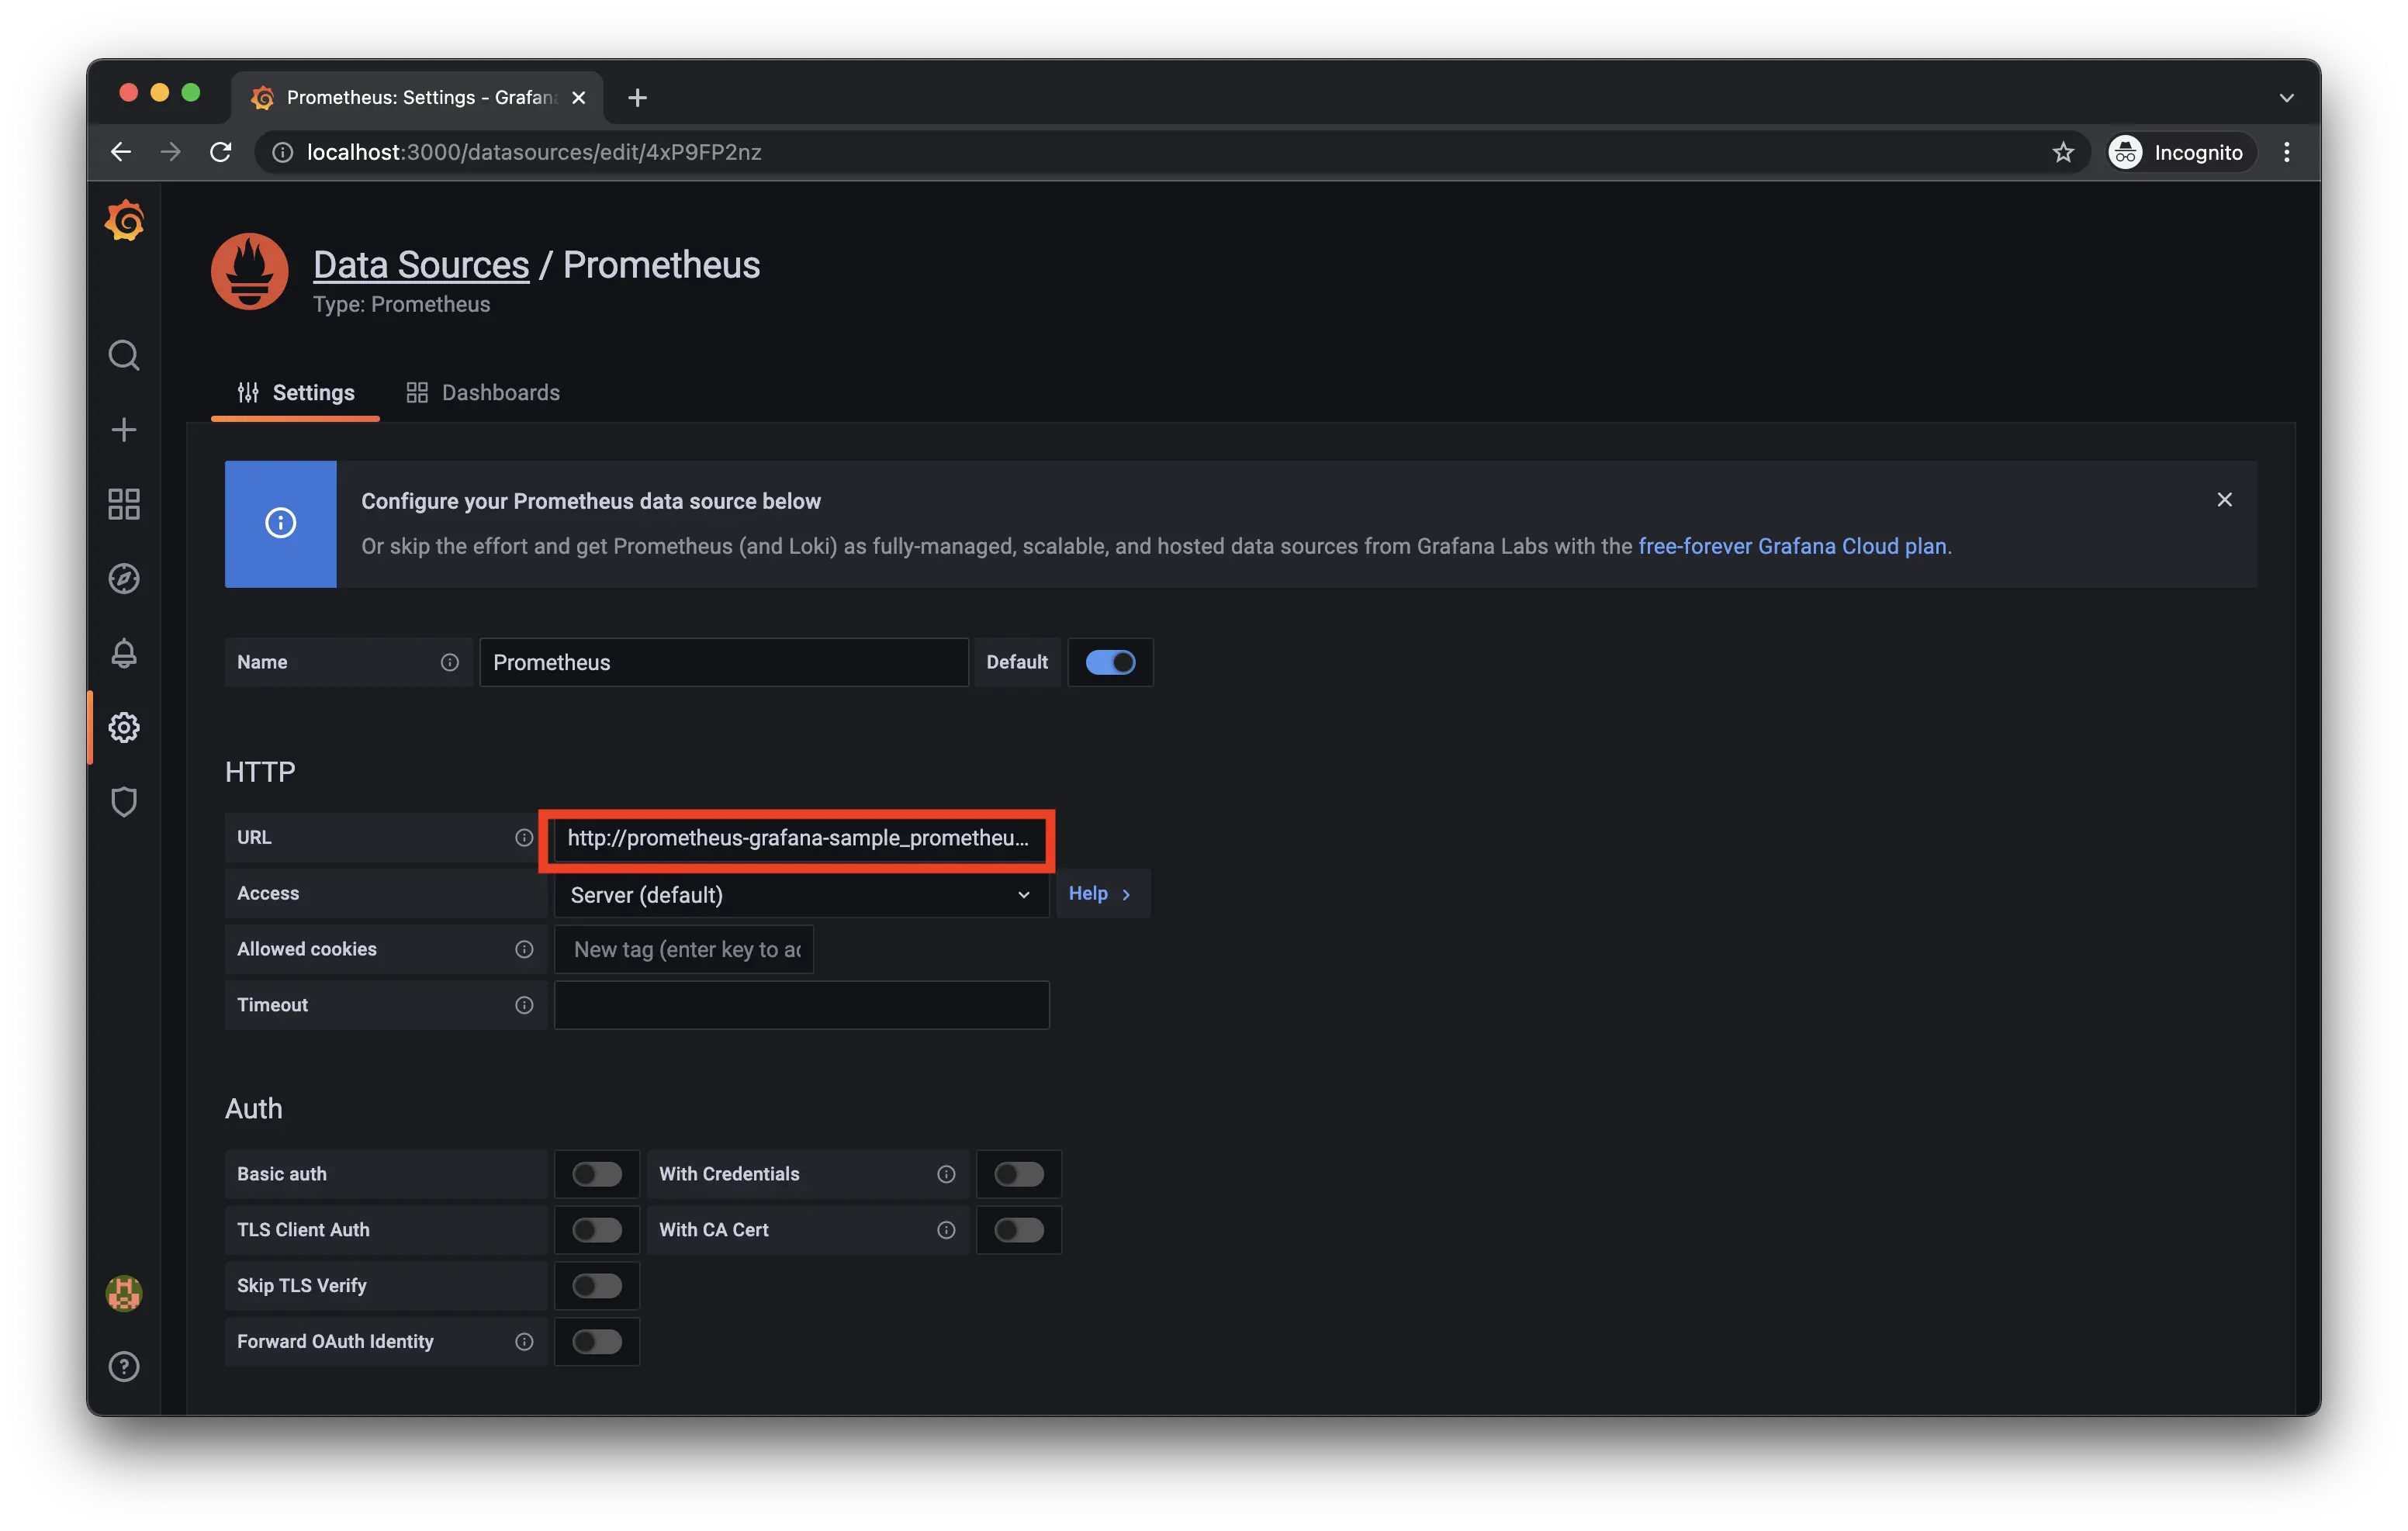
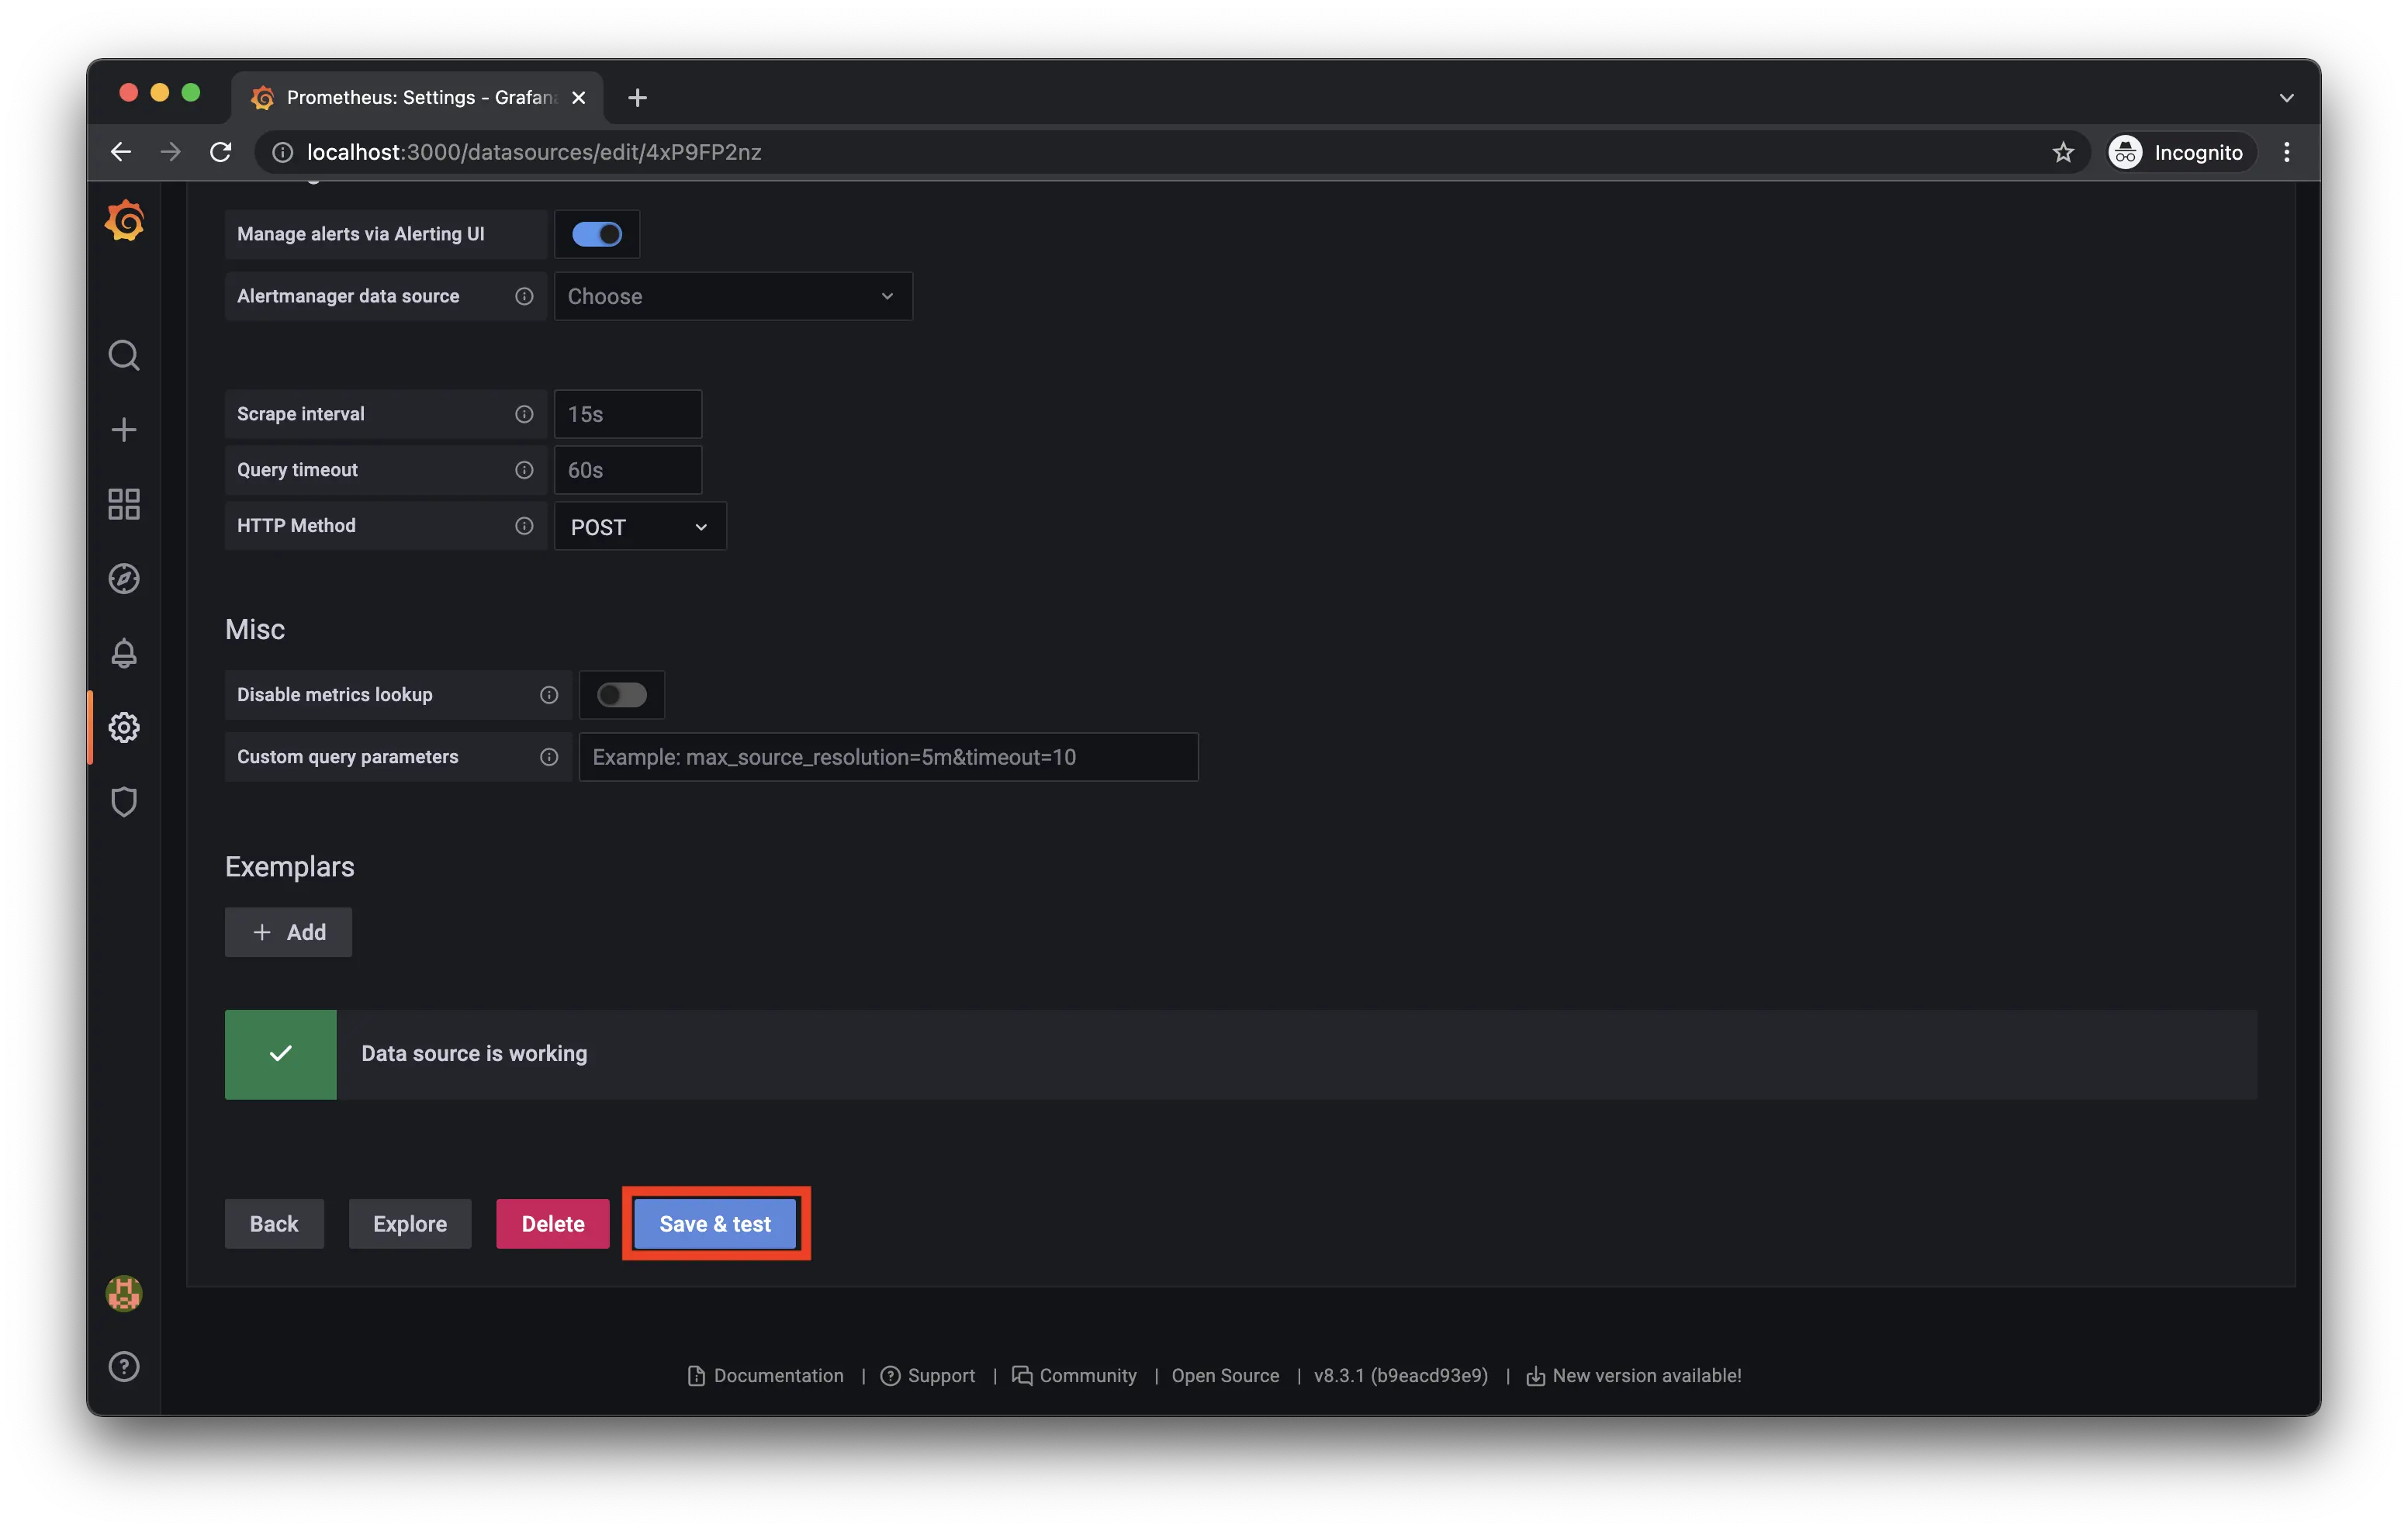
URLの設定ができたら「Save & test」をクリックして、「Data source is working」と出てきたら設定完了です。
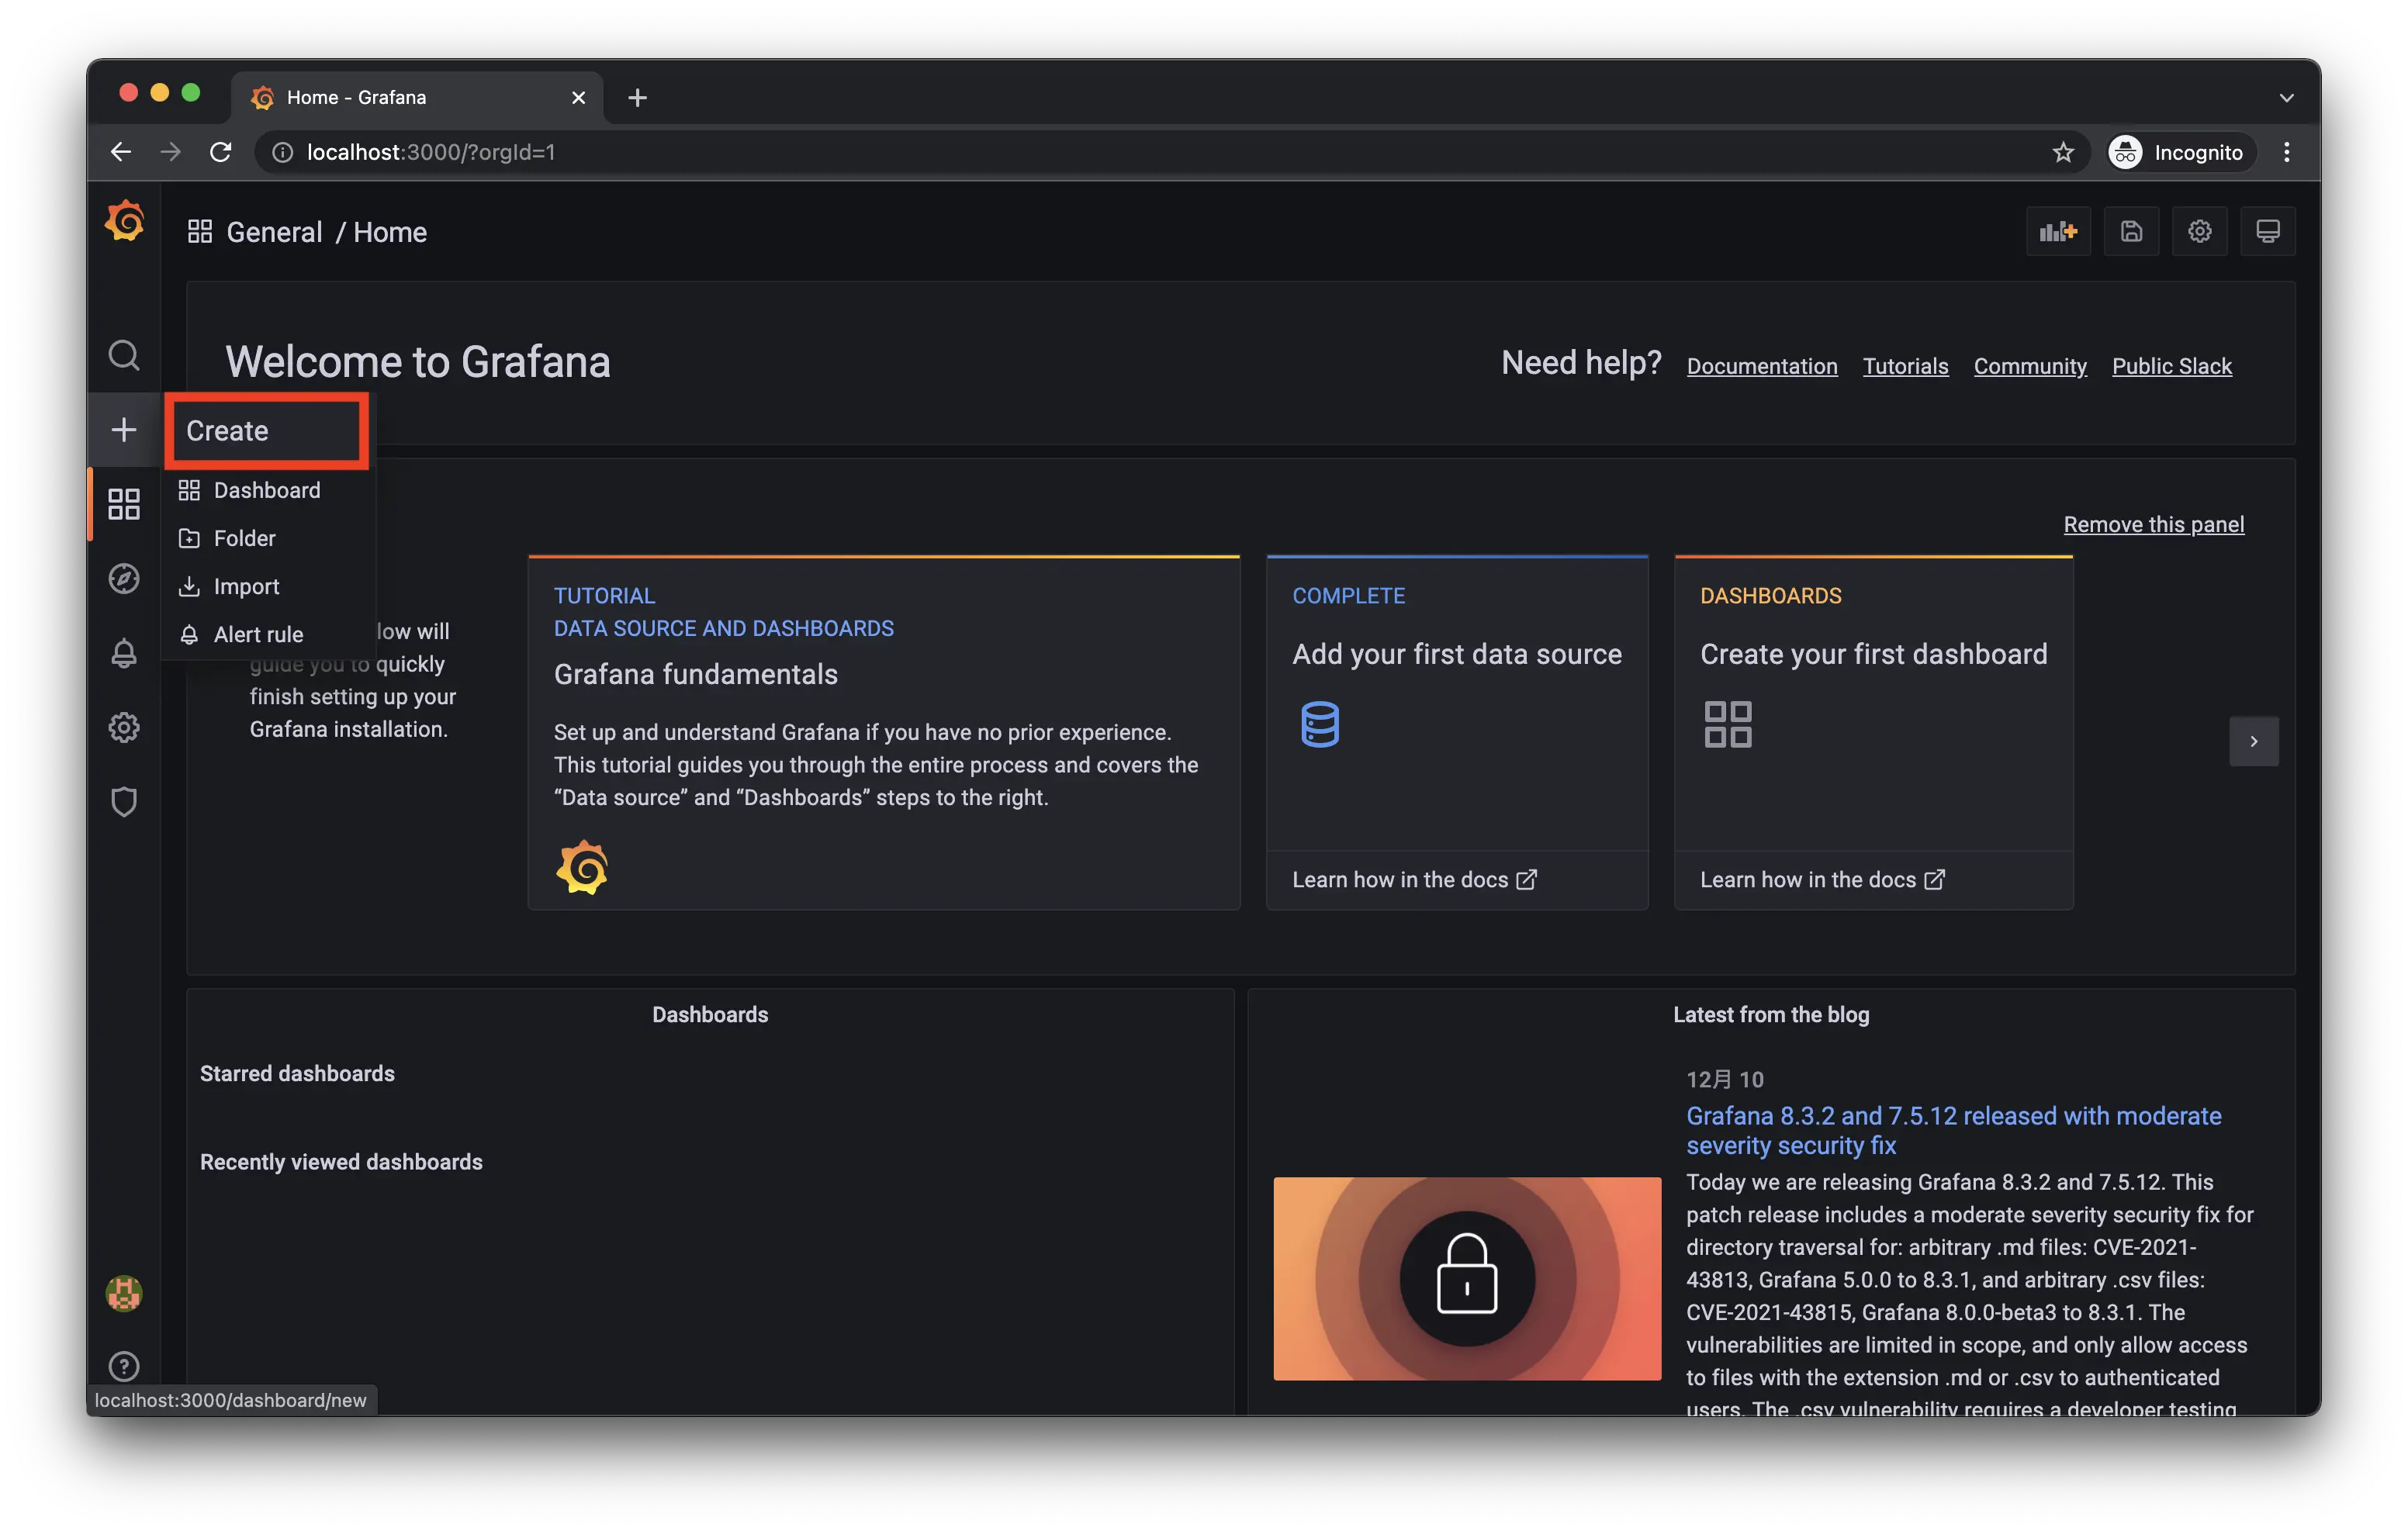
ダッシュボードの作成
次に簡単なダッシュボードをしてみます。
まずは「Create」からダッシュボードの新規作成をします。
ダッシュボードの作成が始まるので、ここから自由にパネルなどを追加してダッシュボードを作成していきます。
とりあえず「Add a new panel」から新しいパネルを追加します。
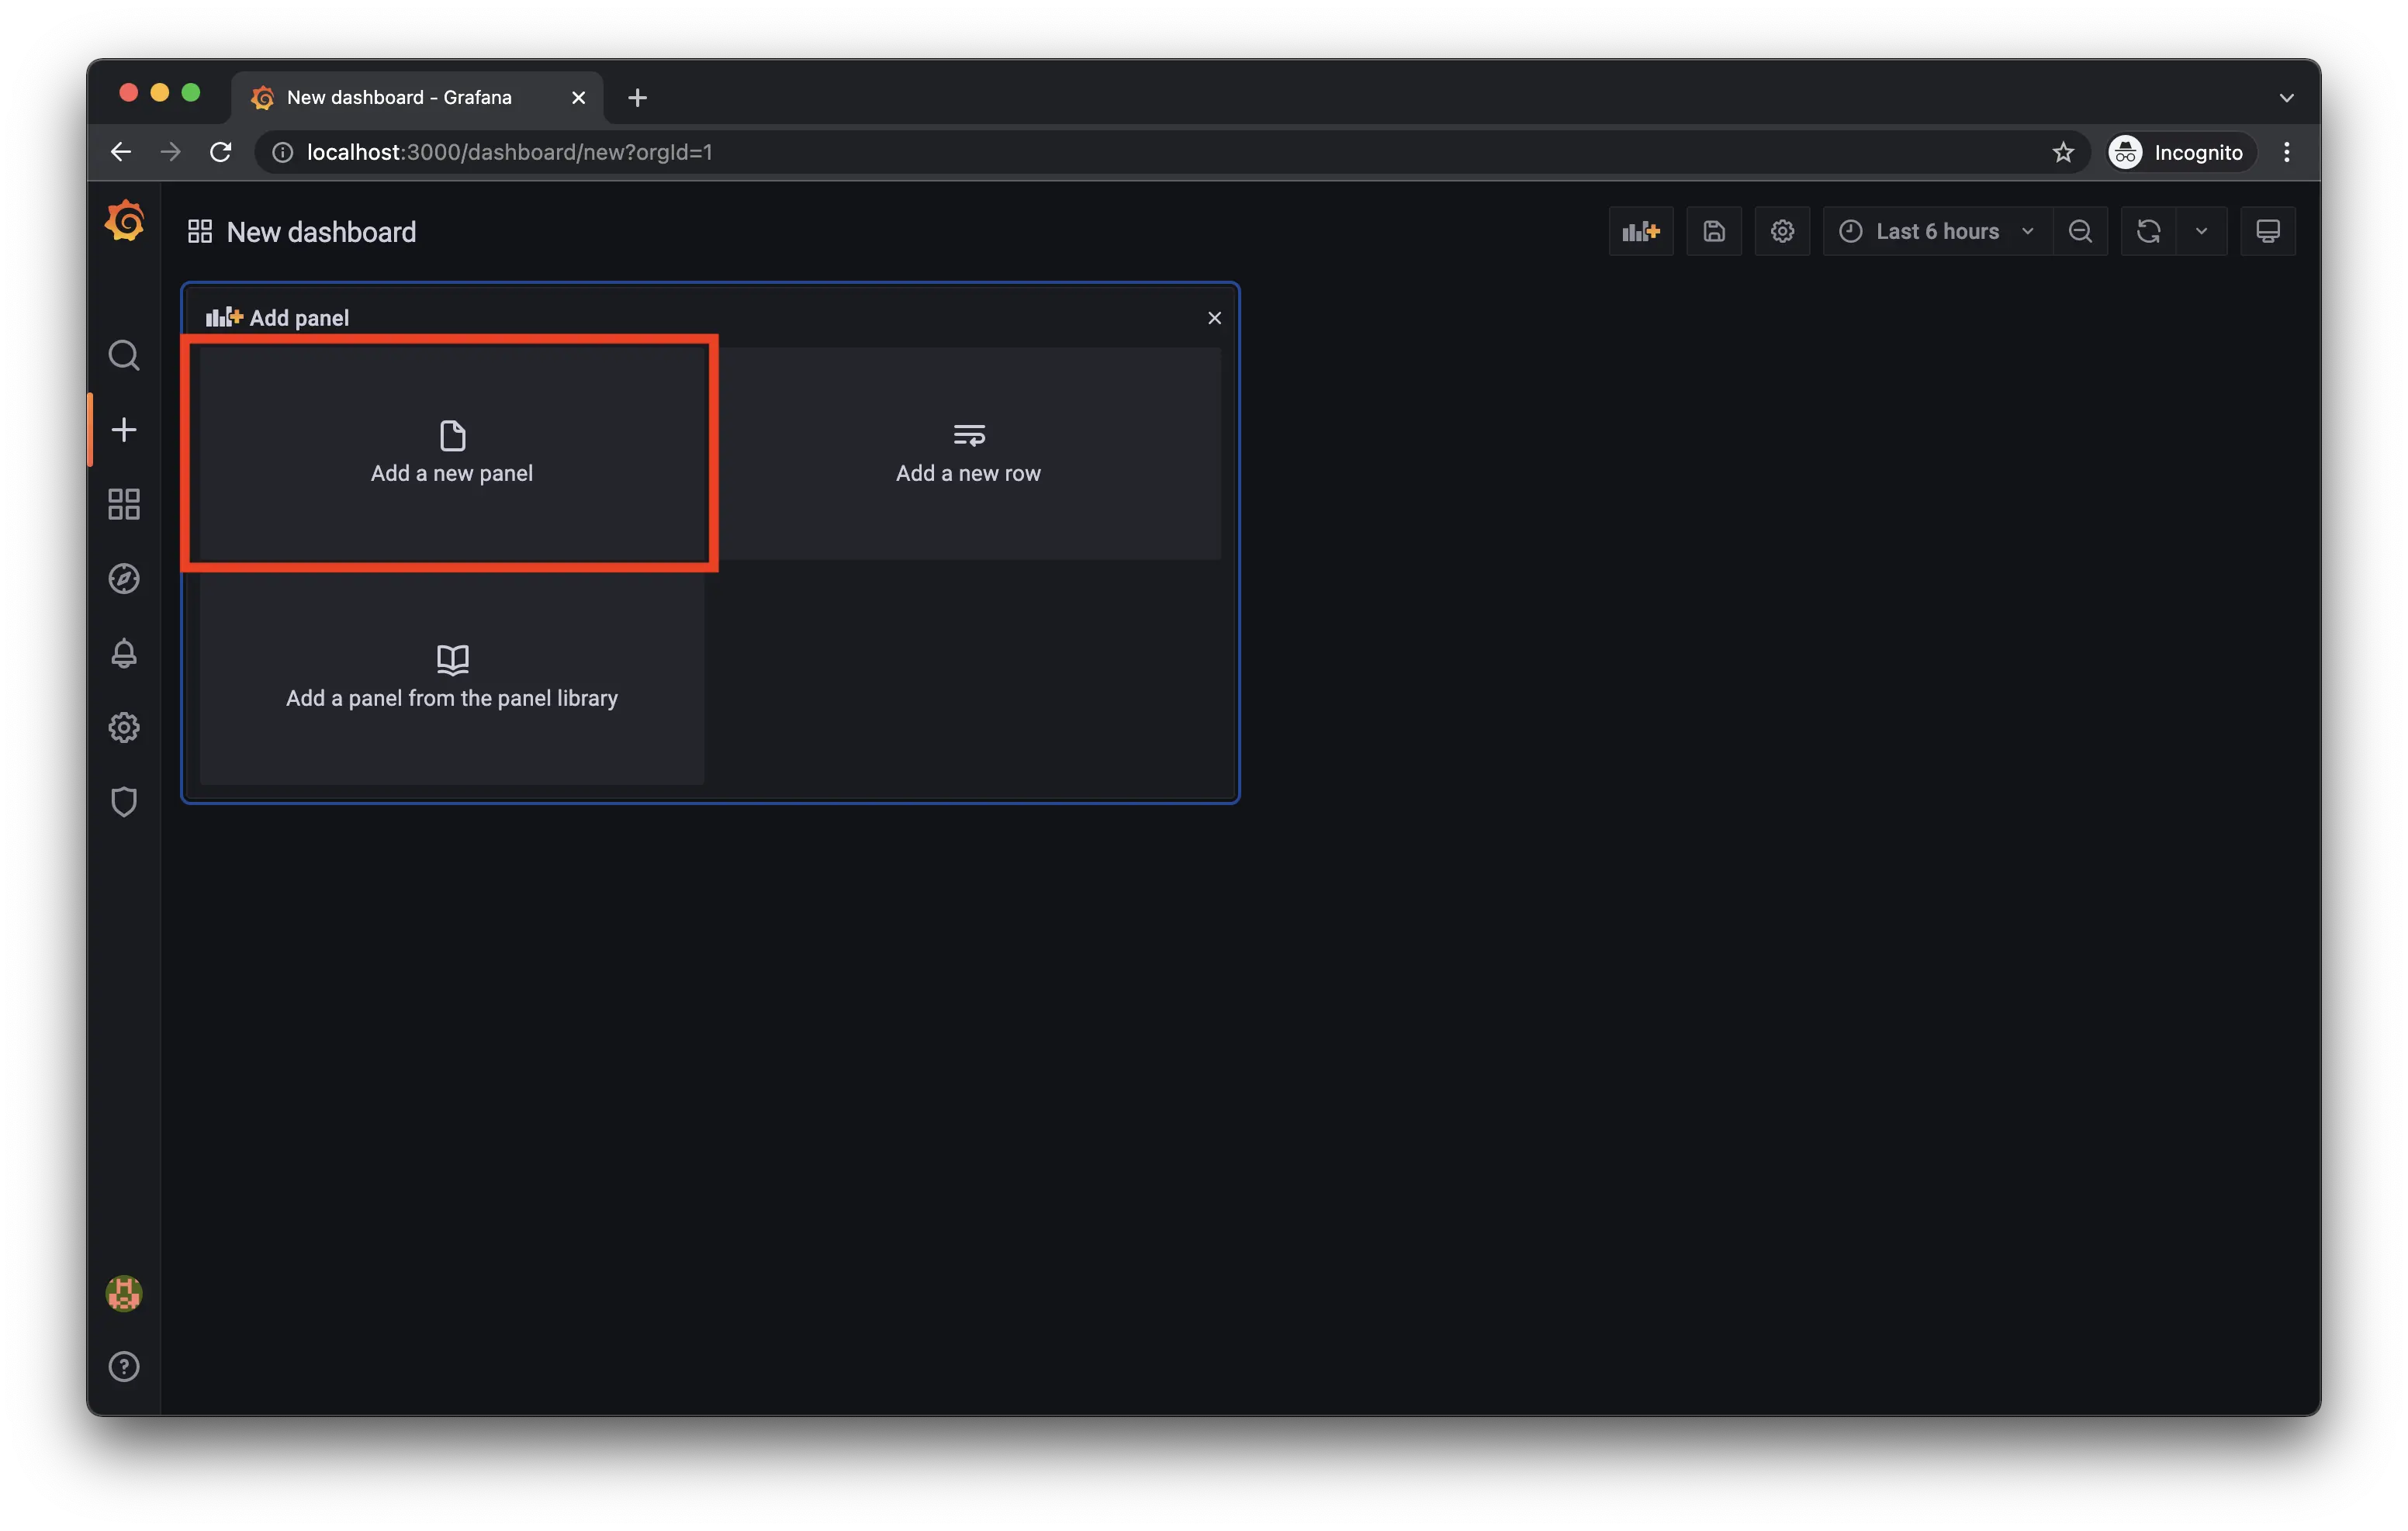
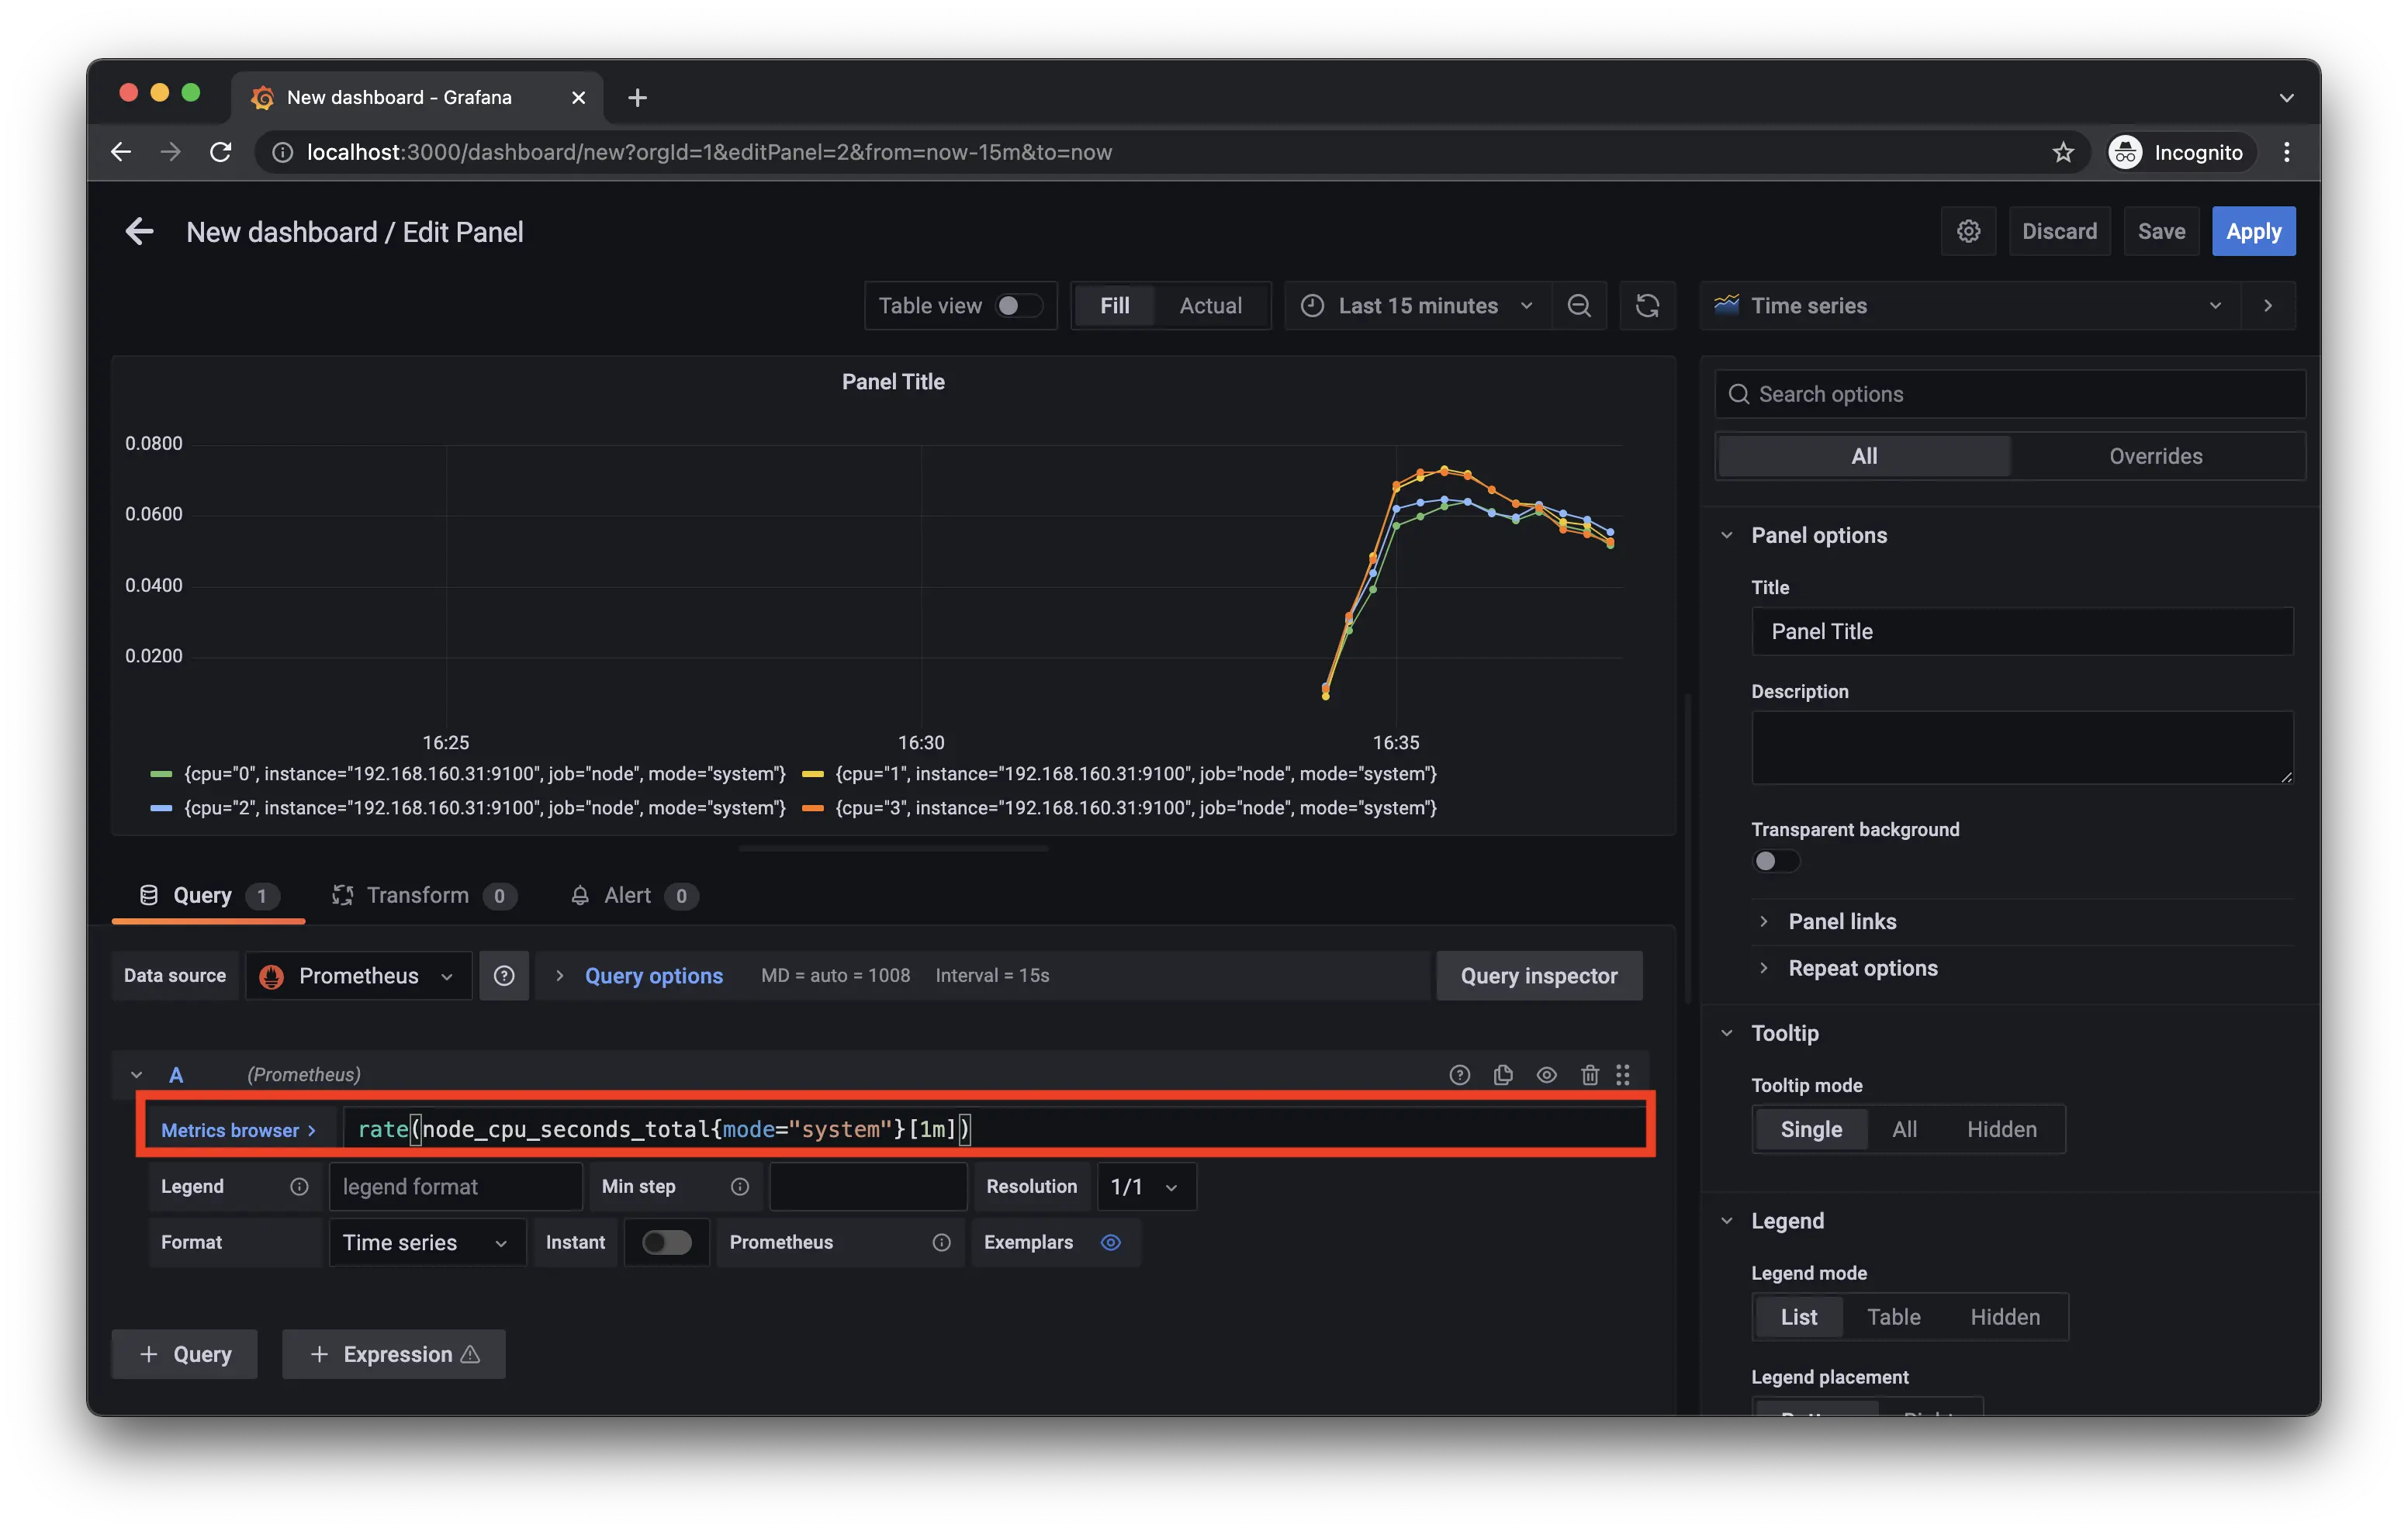
パネルの設定画面になるので、PromQLを使ってPrometheusのメトリクスからデータを可視化します。その他、パネル名など様々な設定が可能です。
ここではrate(node_cpu_seconds_total{mode="system"}[1m])を設定しています。
他にもパネルなどを追加してダッシュボードをカスタマイズできます。
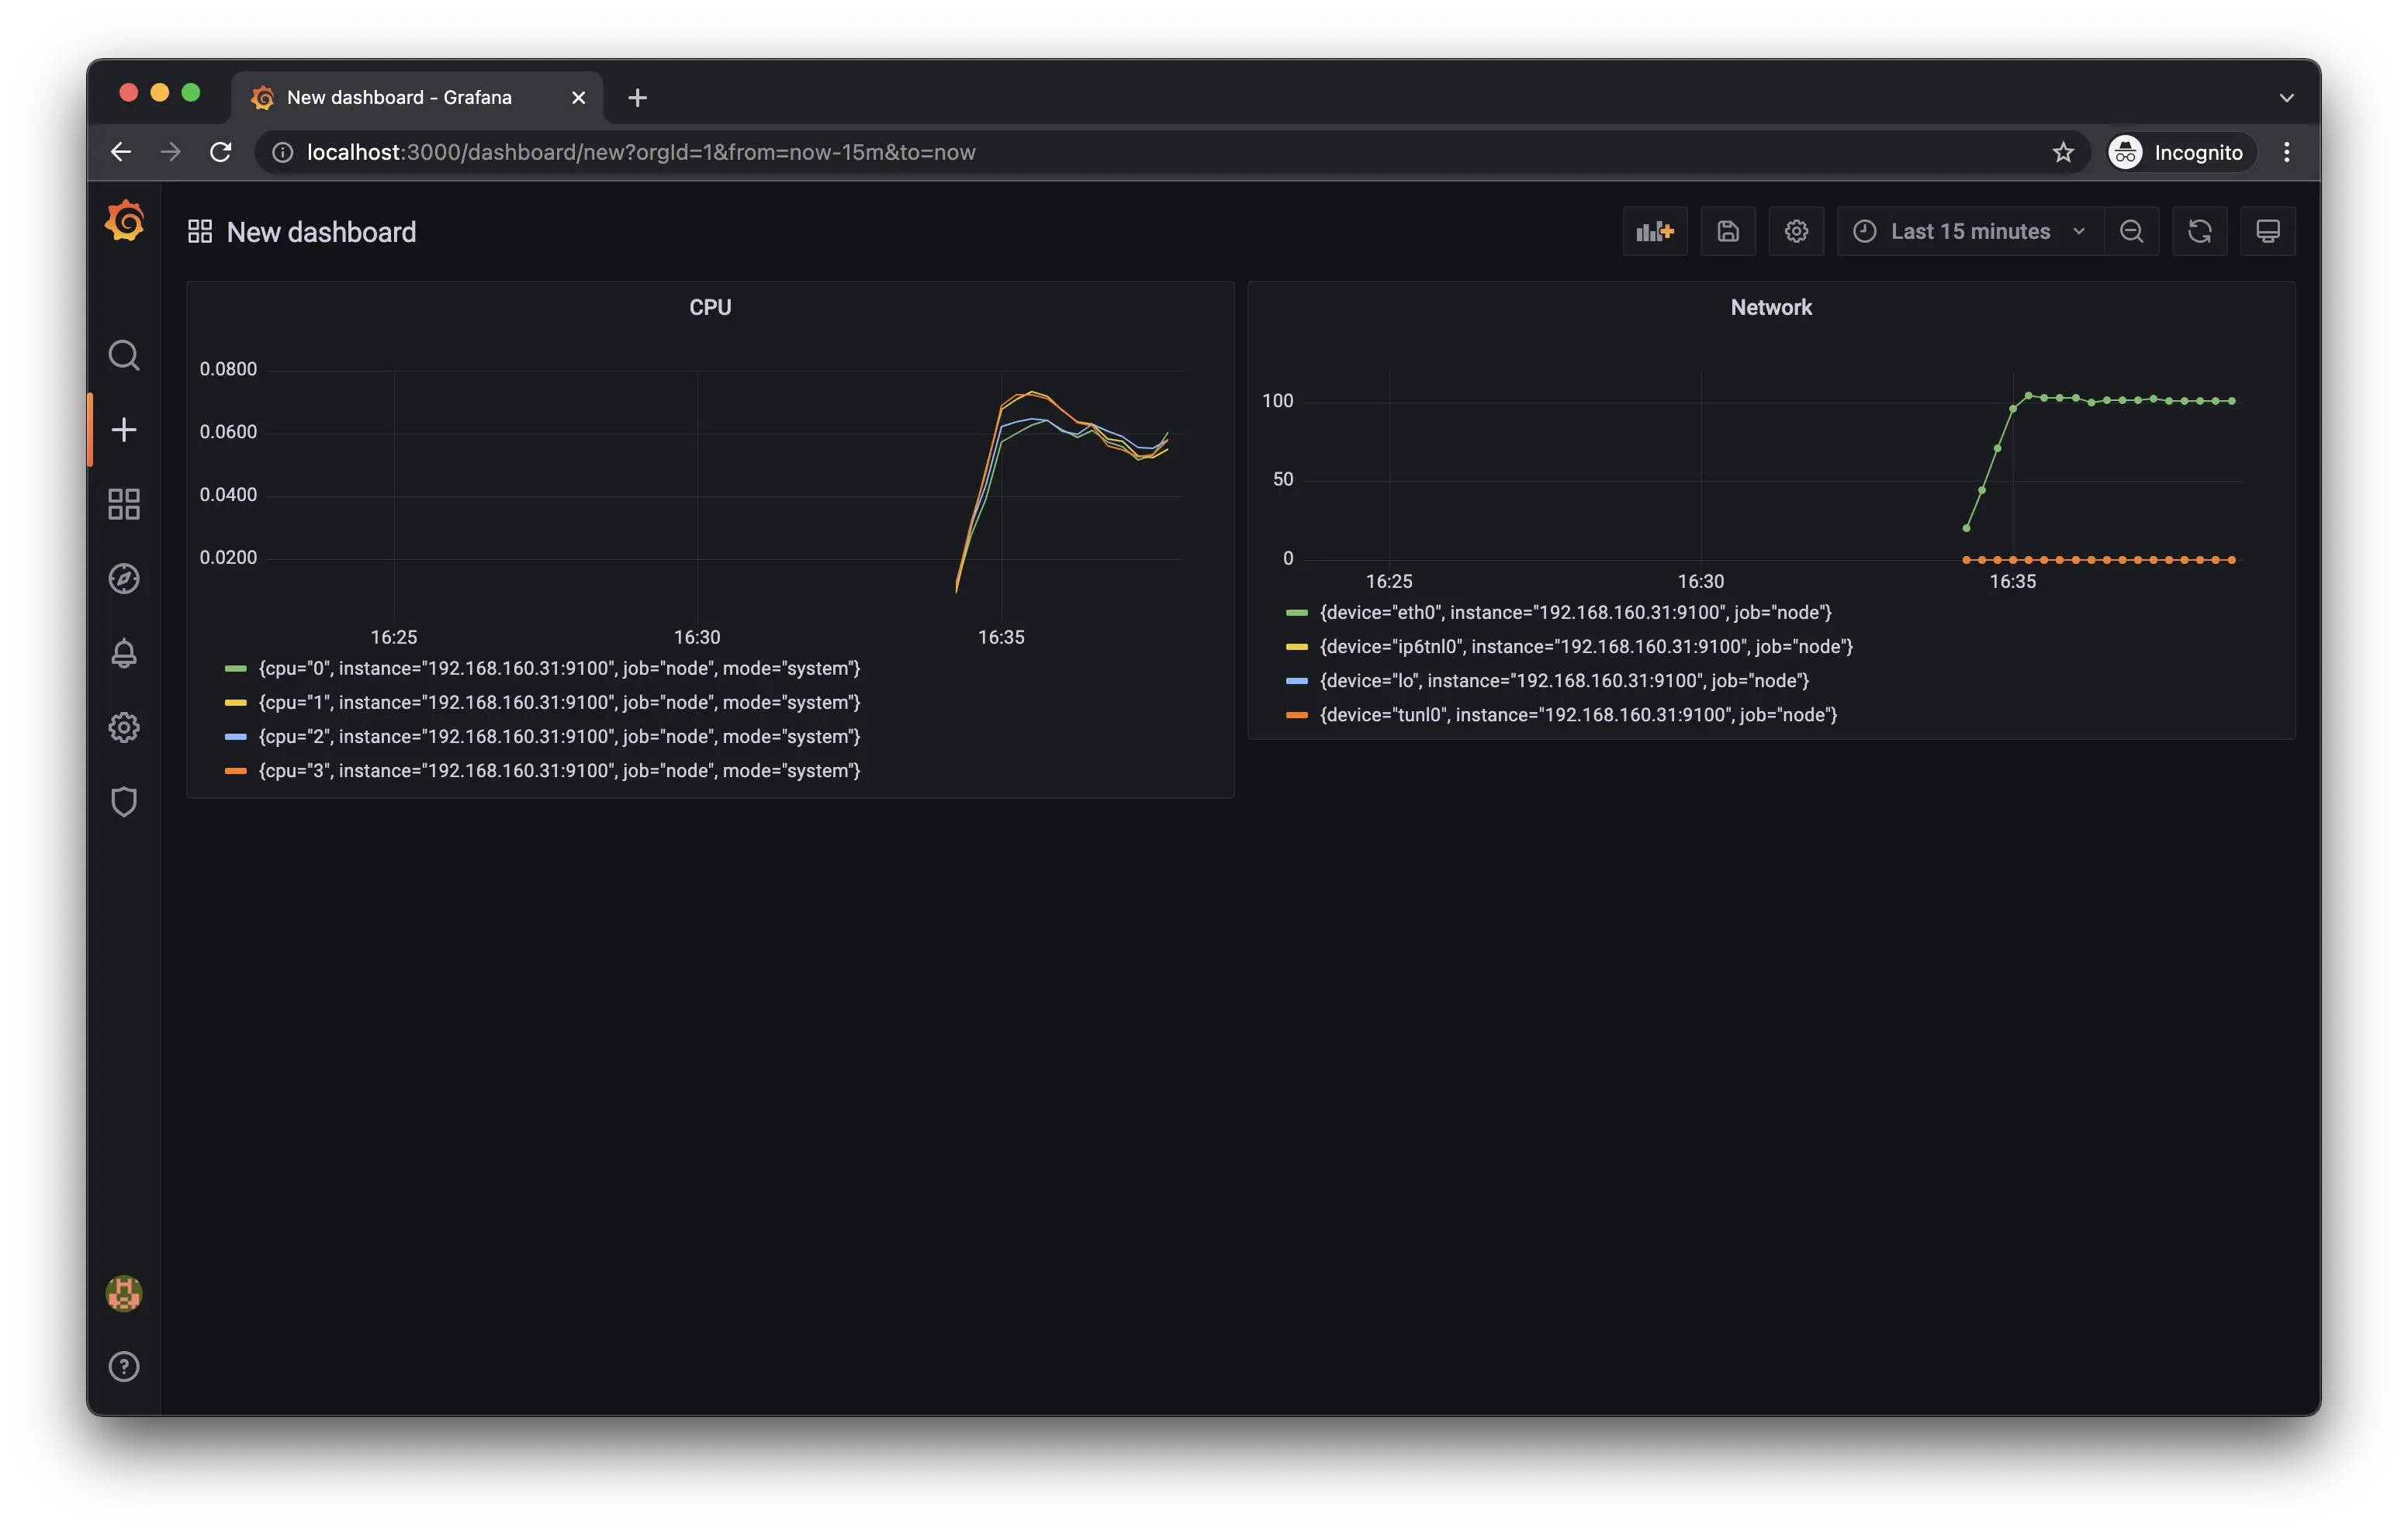
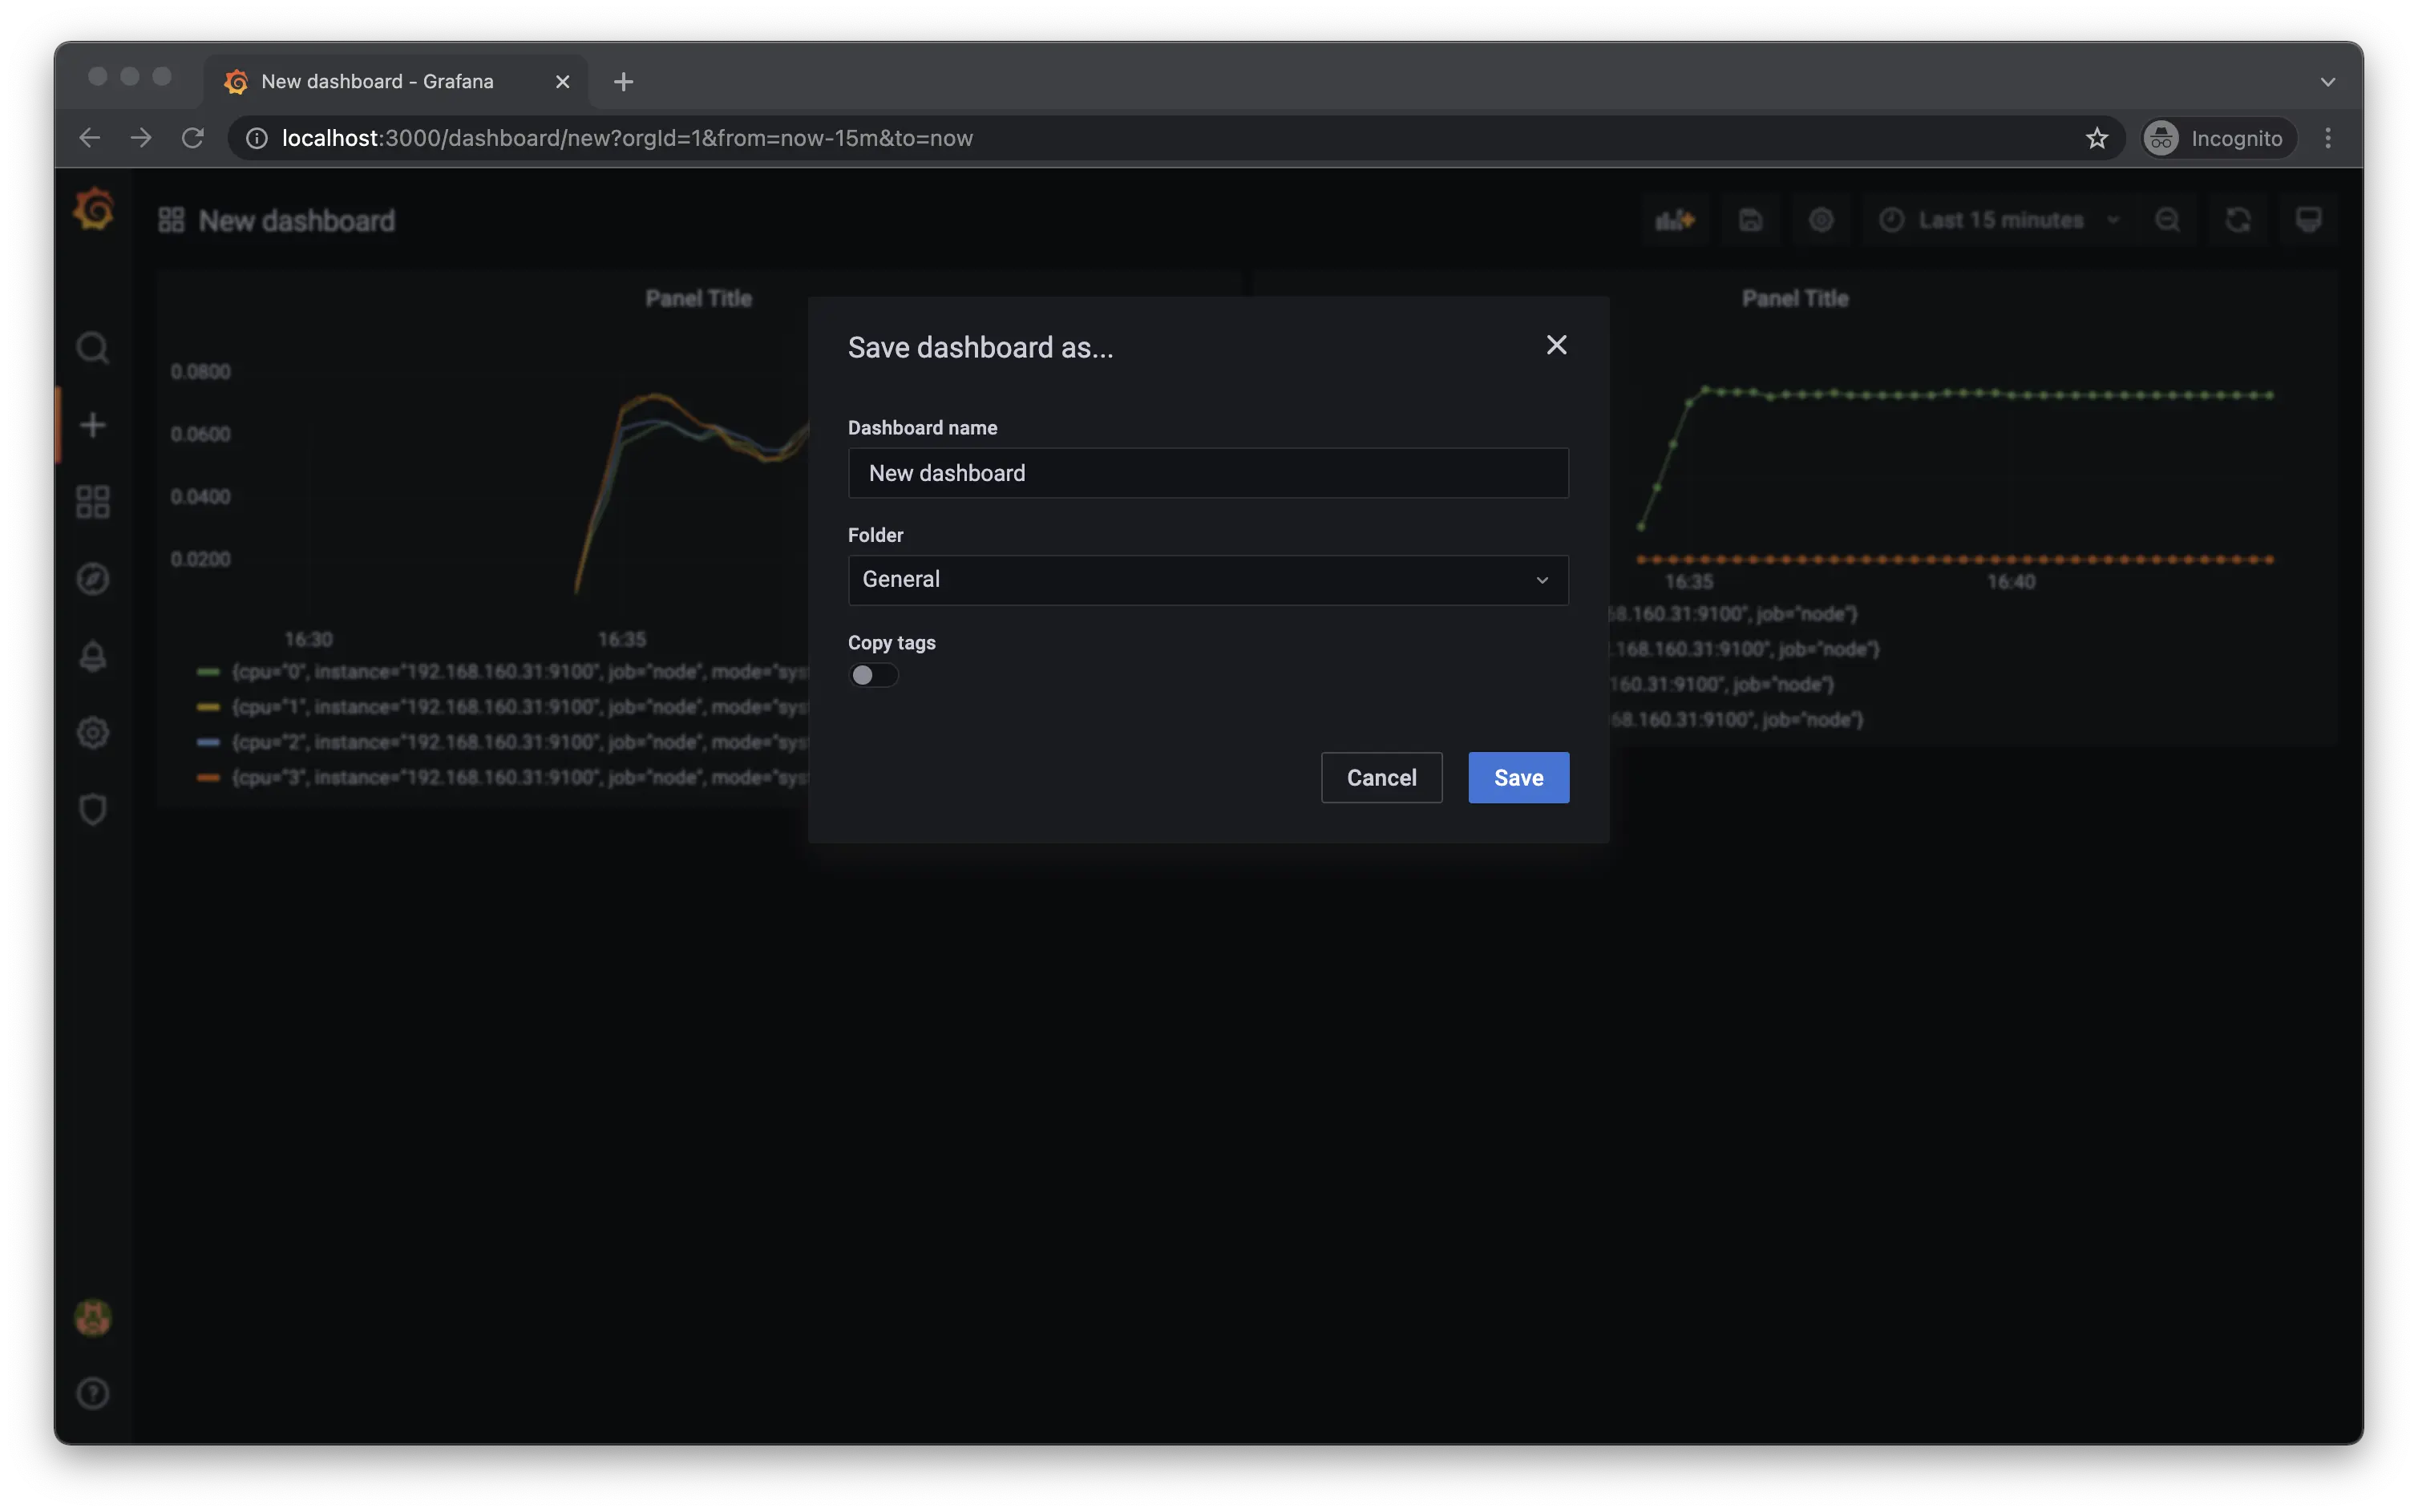
最後にダッシュボードを保存すれば完了です。
ダッシュボードのインポート
Grafanaでは、様々なダッシュボードが公開されており、インポートすることで簡単にダッシュボードの作成が可能です。

Dashboards | Grafana Labs
Browse a library of official and community-built dashboards.
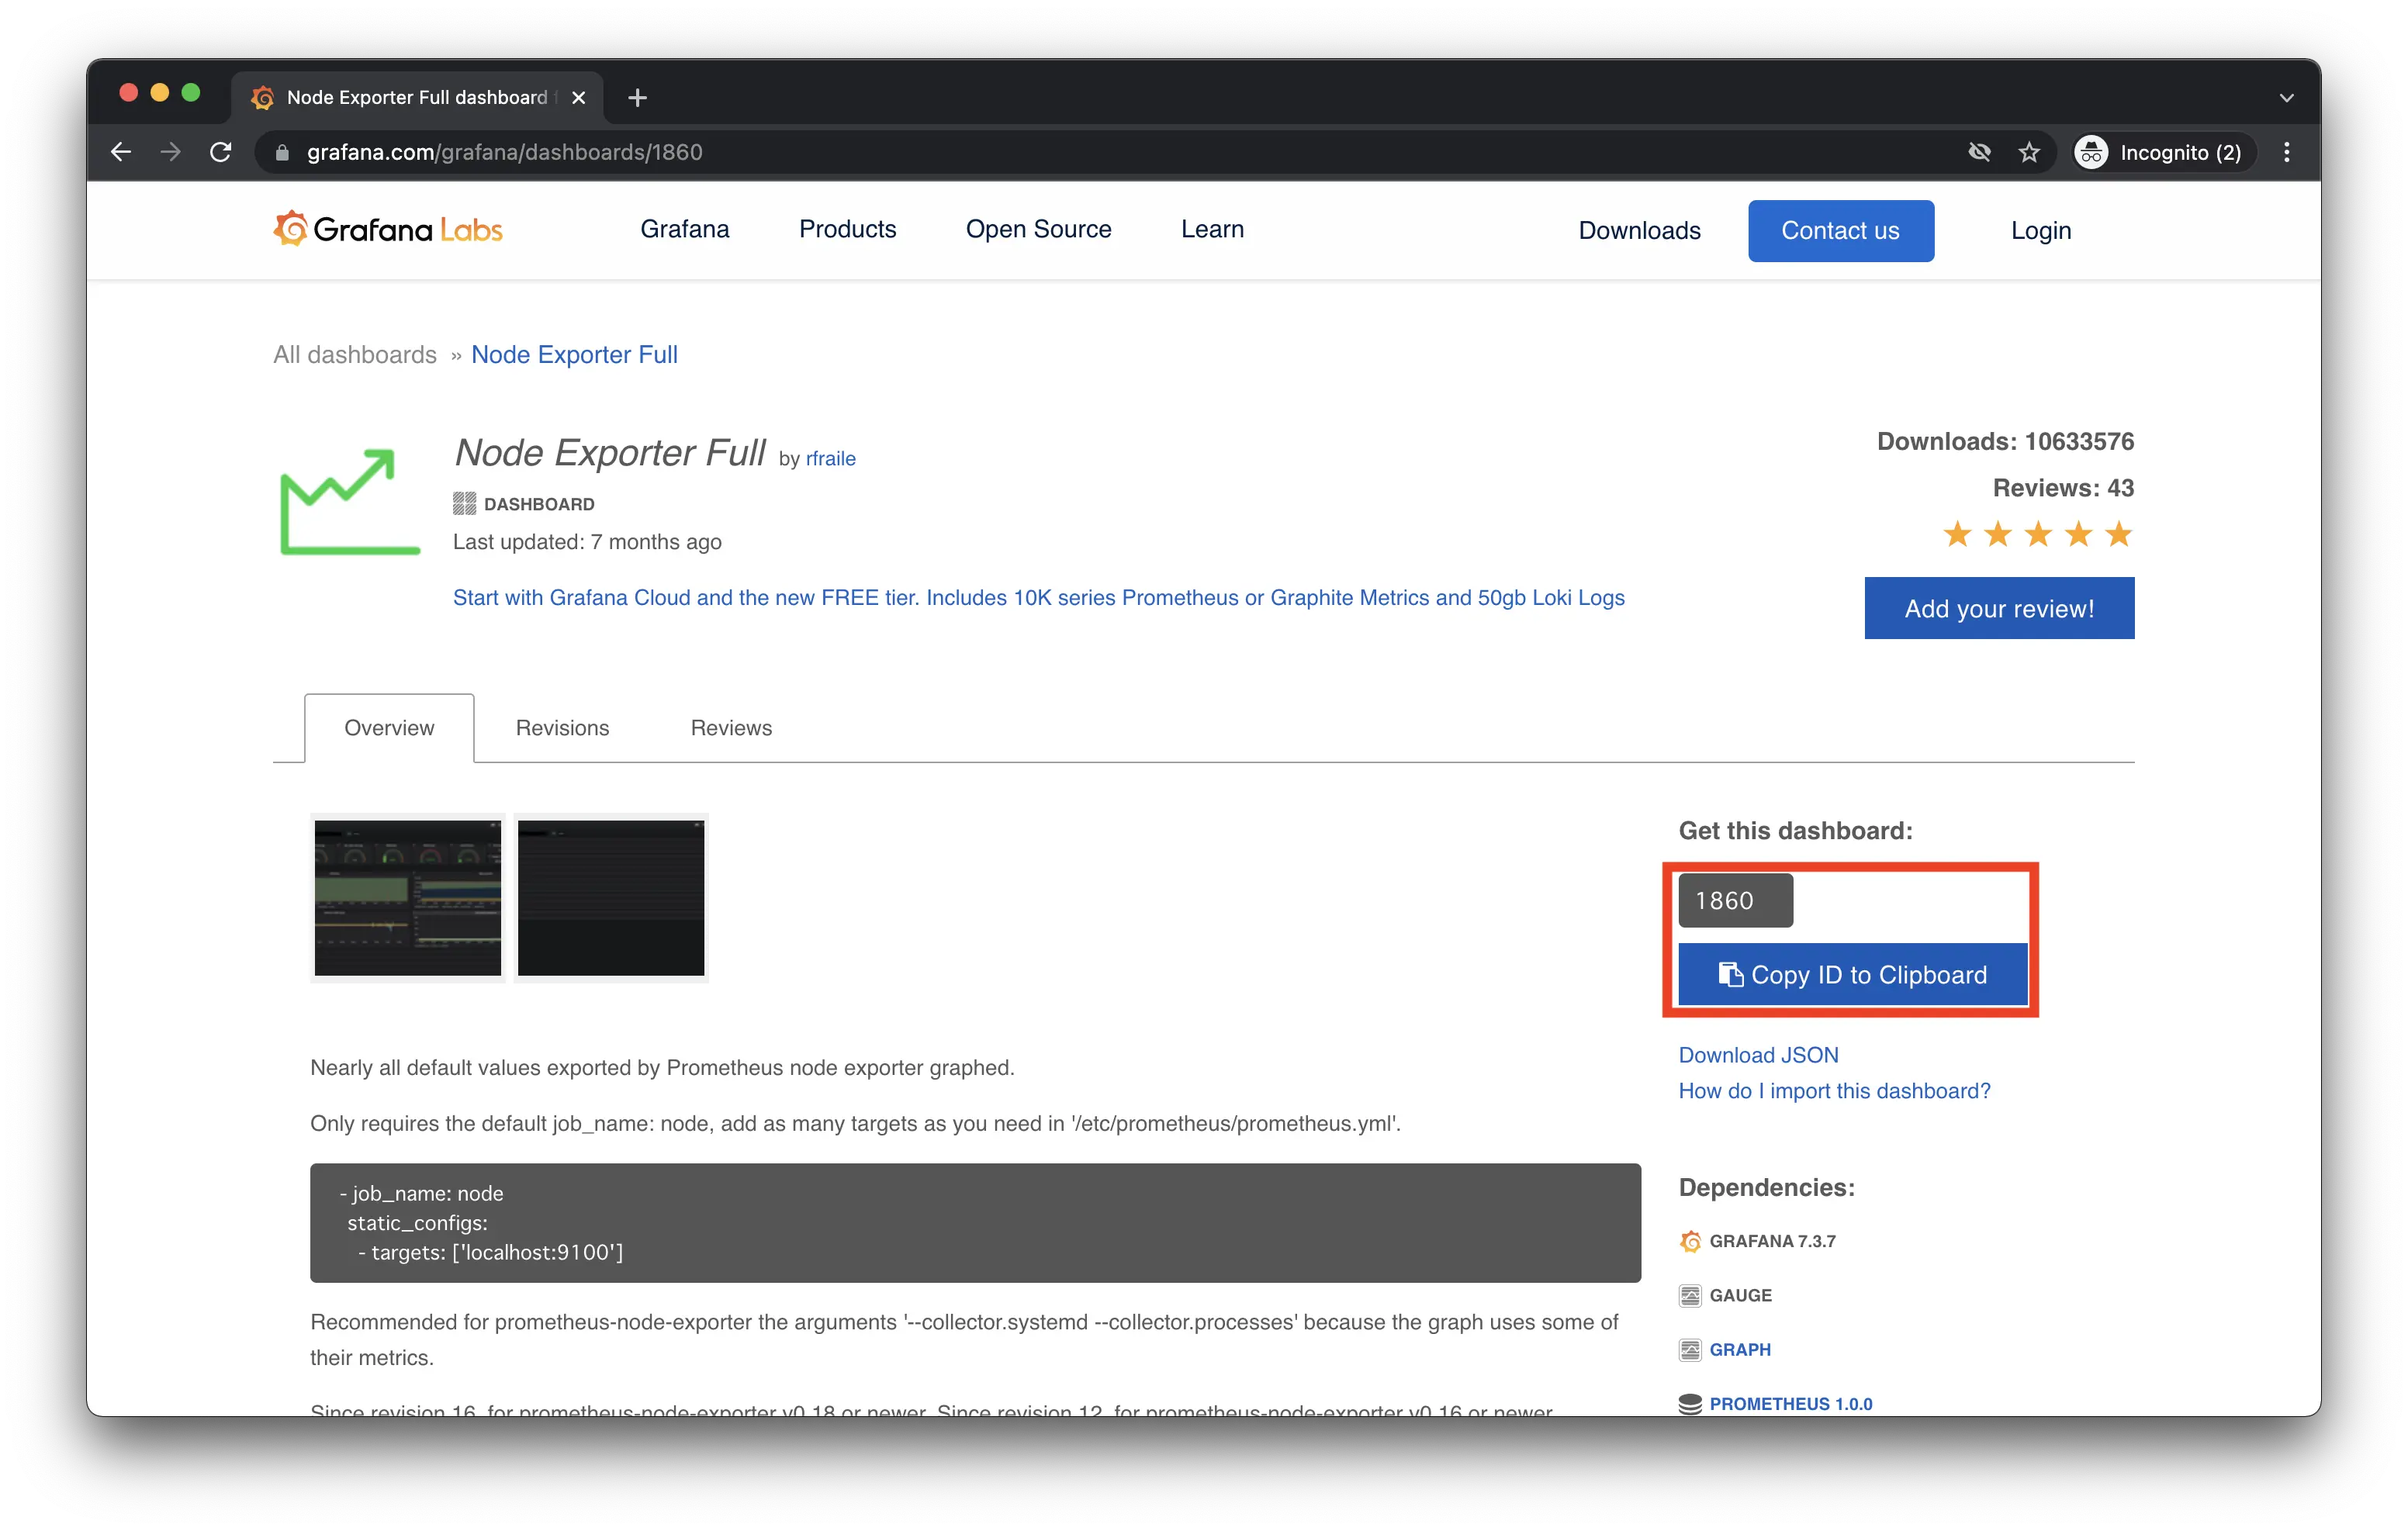
今回は、node exporter用のダッシュボードをインポートしてみます。

Node Exporter Full | Grafana Labs
Nearly all default values exported by Prometheus node exporter graphed. Only requires the default job_name: node, add as many targets as you need in ‘/etc/prometheus/prometheus.yml’. Copy - job_name: node static_configs: - targets: ['localhost:9100'] Recommended for prometheus-node-exporter the arguments ‘–collector.systemd –collector.processes’ because the graph uses some of their metrics. Since revision 16, for prometheus-node-exporter v0.18 or newer. Since revision 12, for prometheus-node-exporter v0.16 or newer. Available on github: https://github.com/rfmoz/grafana-dashboards.git
公開されているページからIDをコピーしておきます。
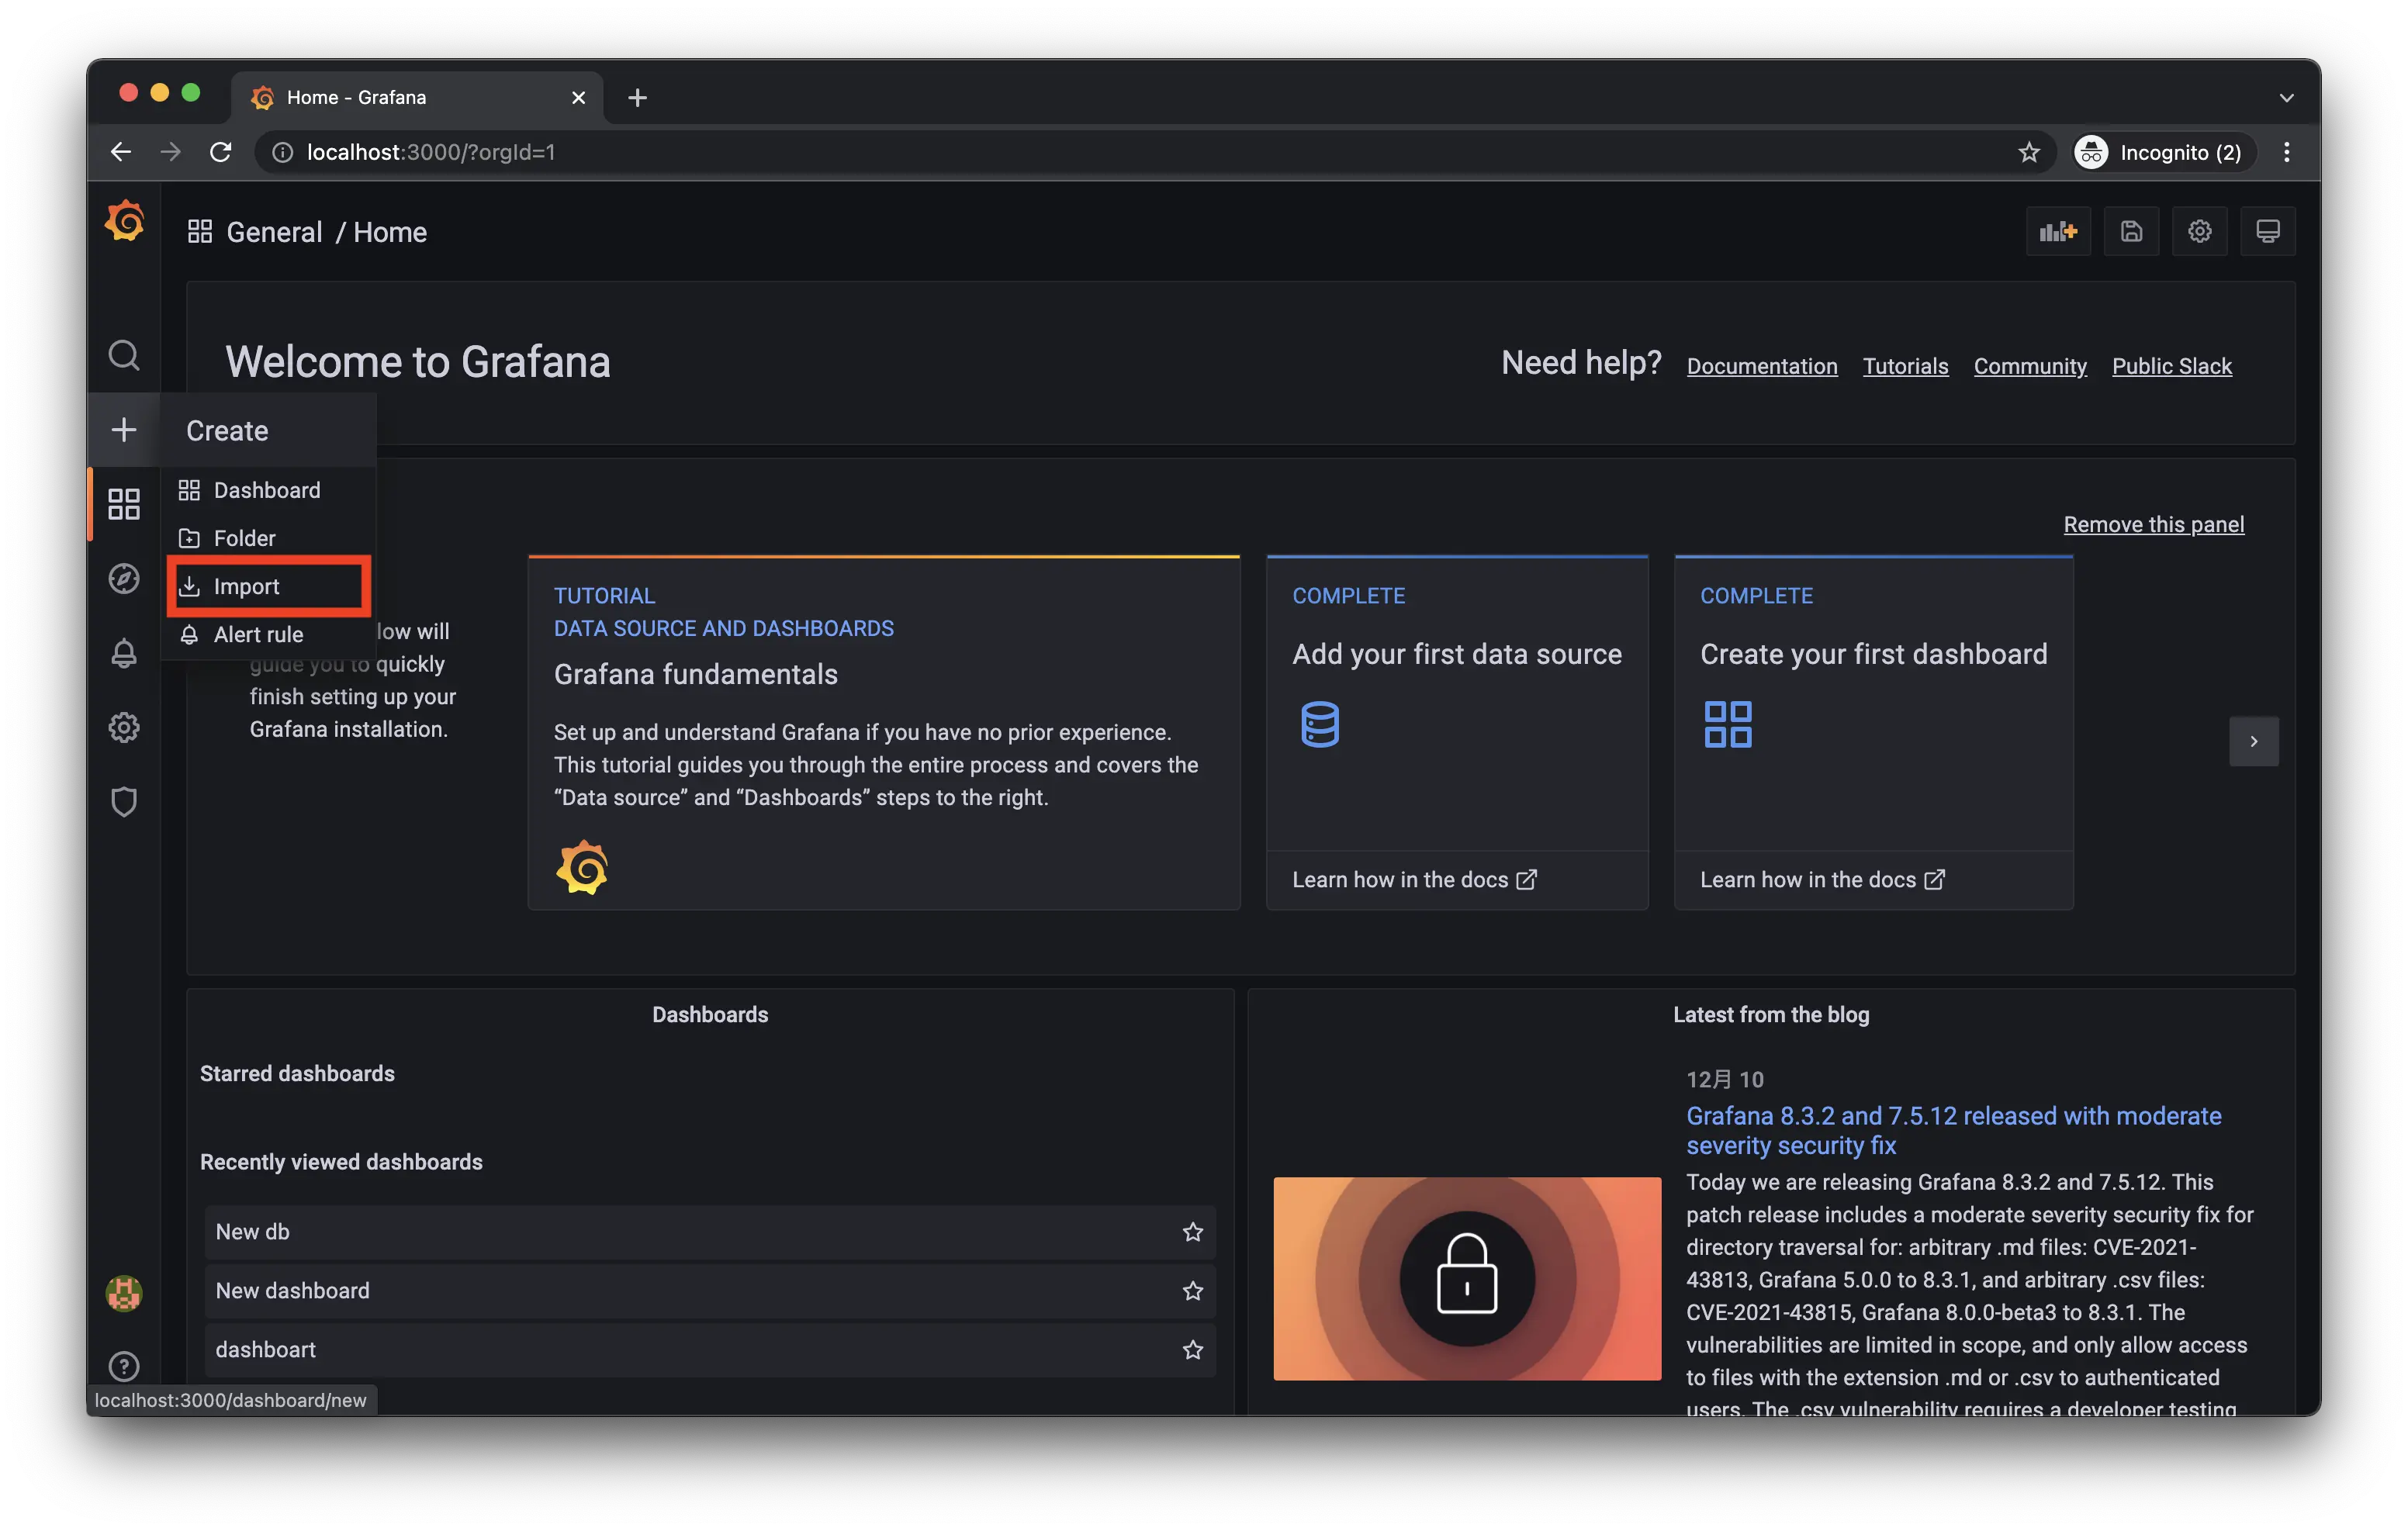
「Import」からダッシュボードのインポートが可能です。
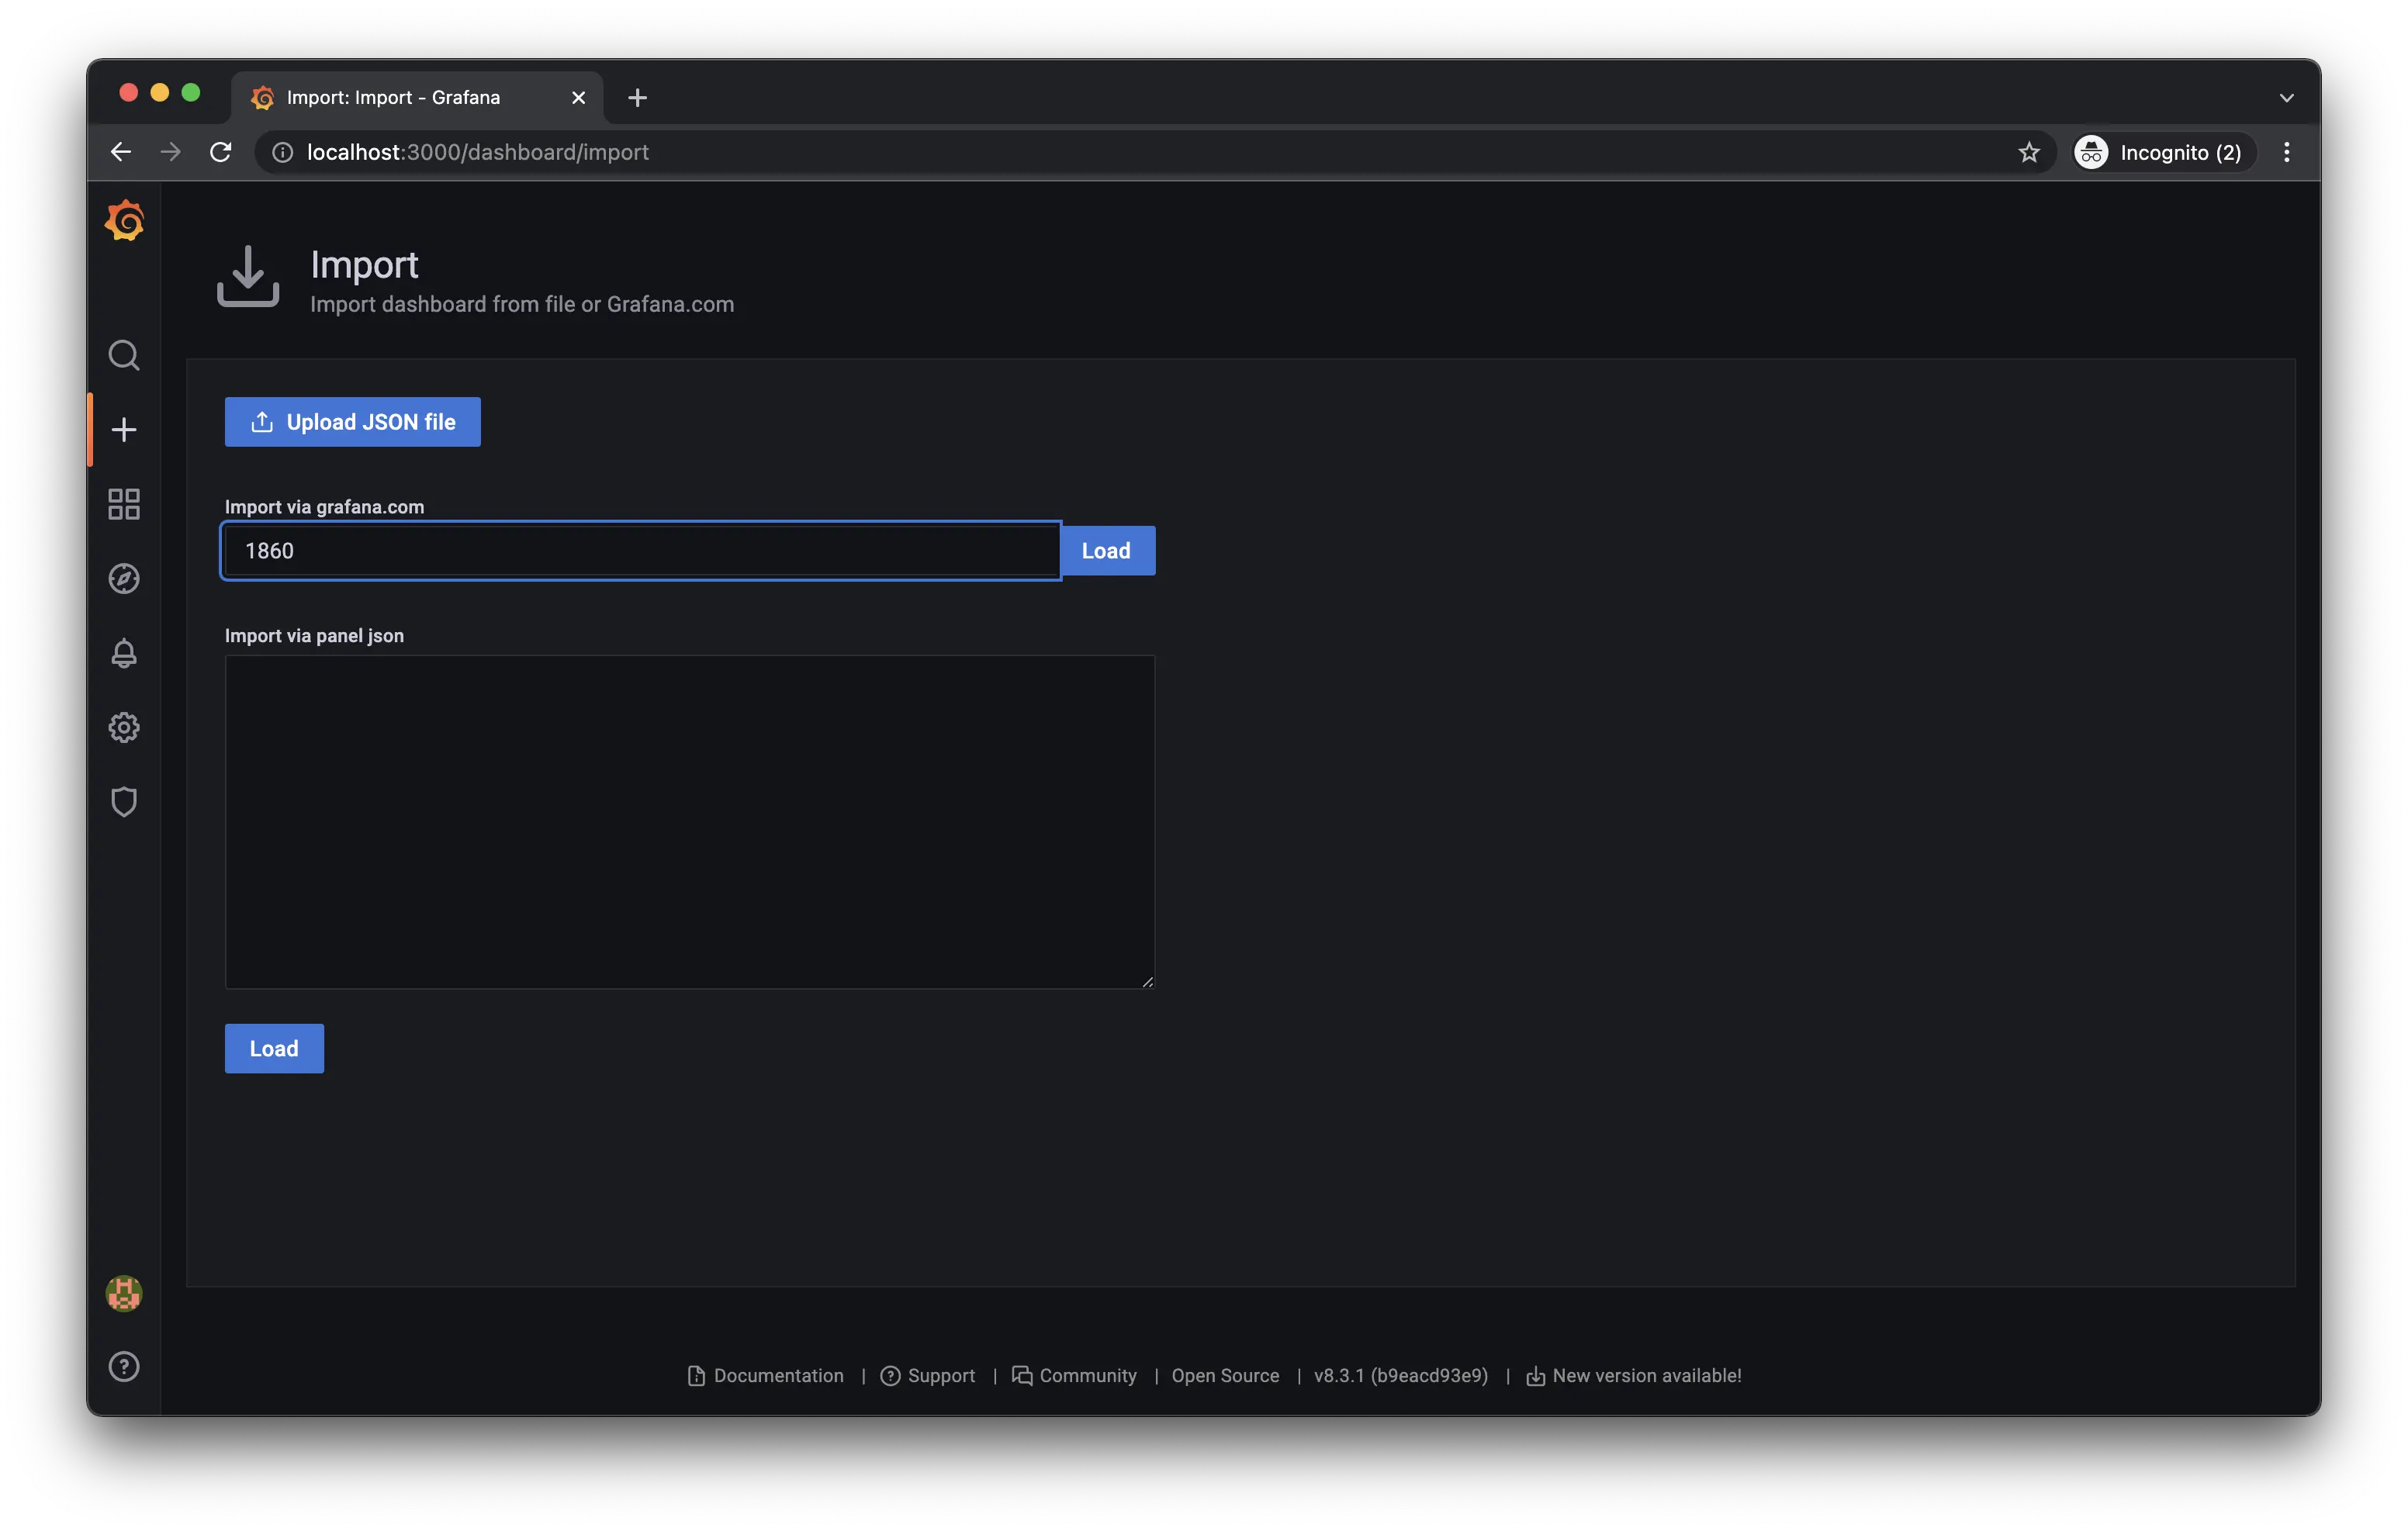
先ほどコピーしたIDを貼り付け、「Load」をクリックします。
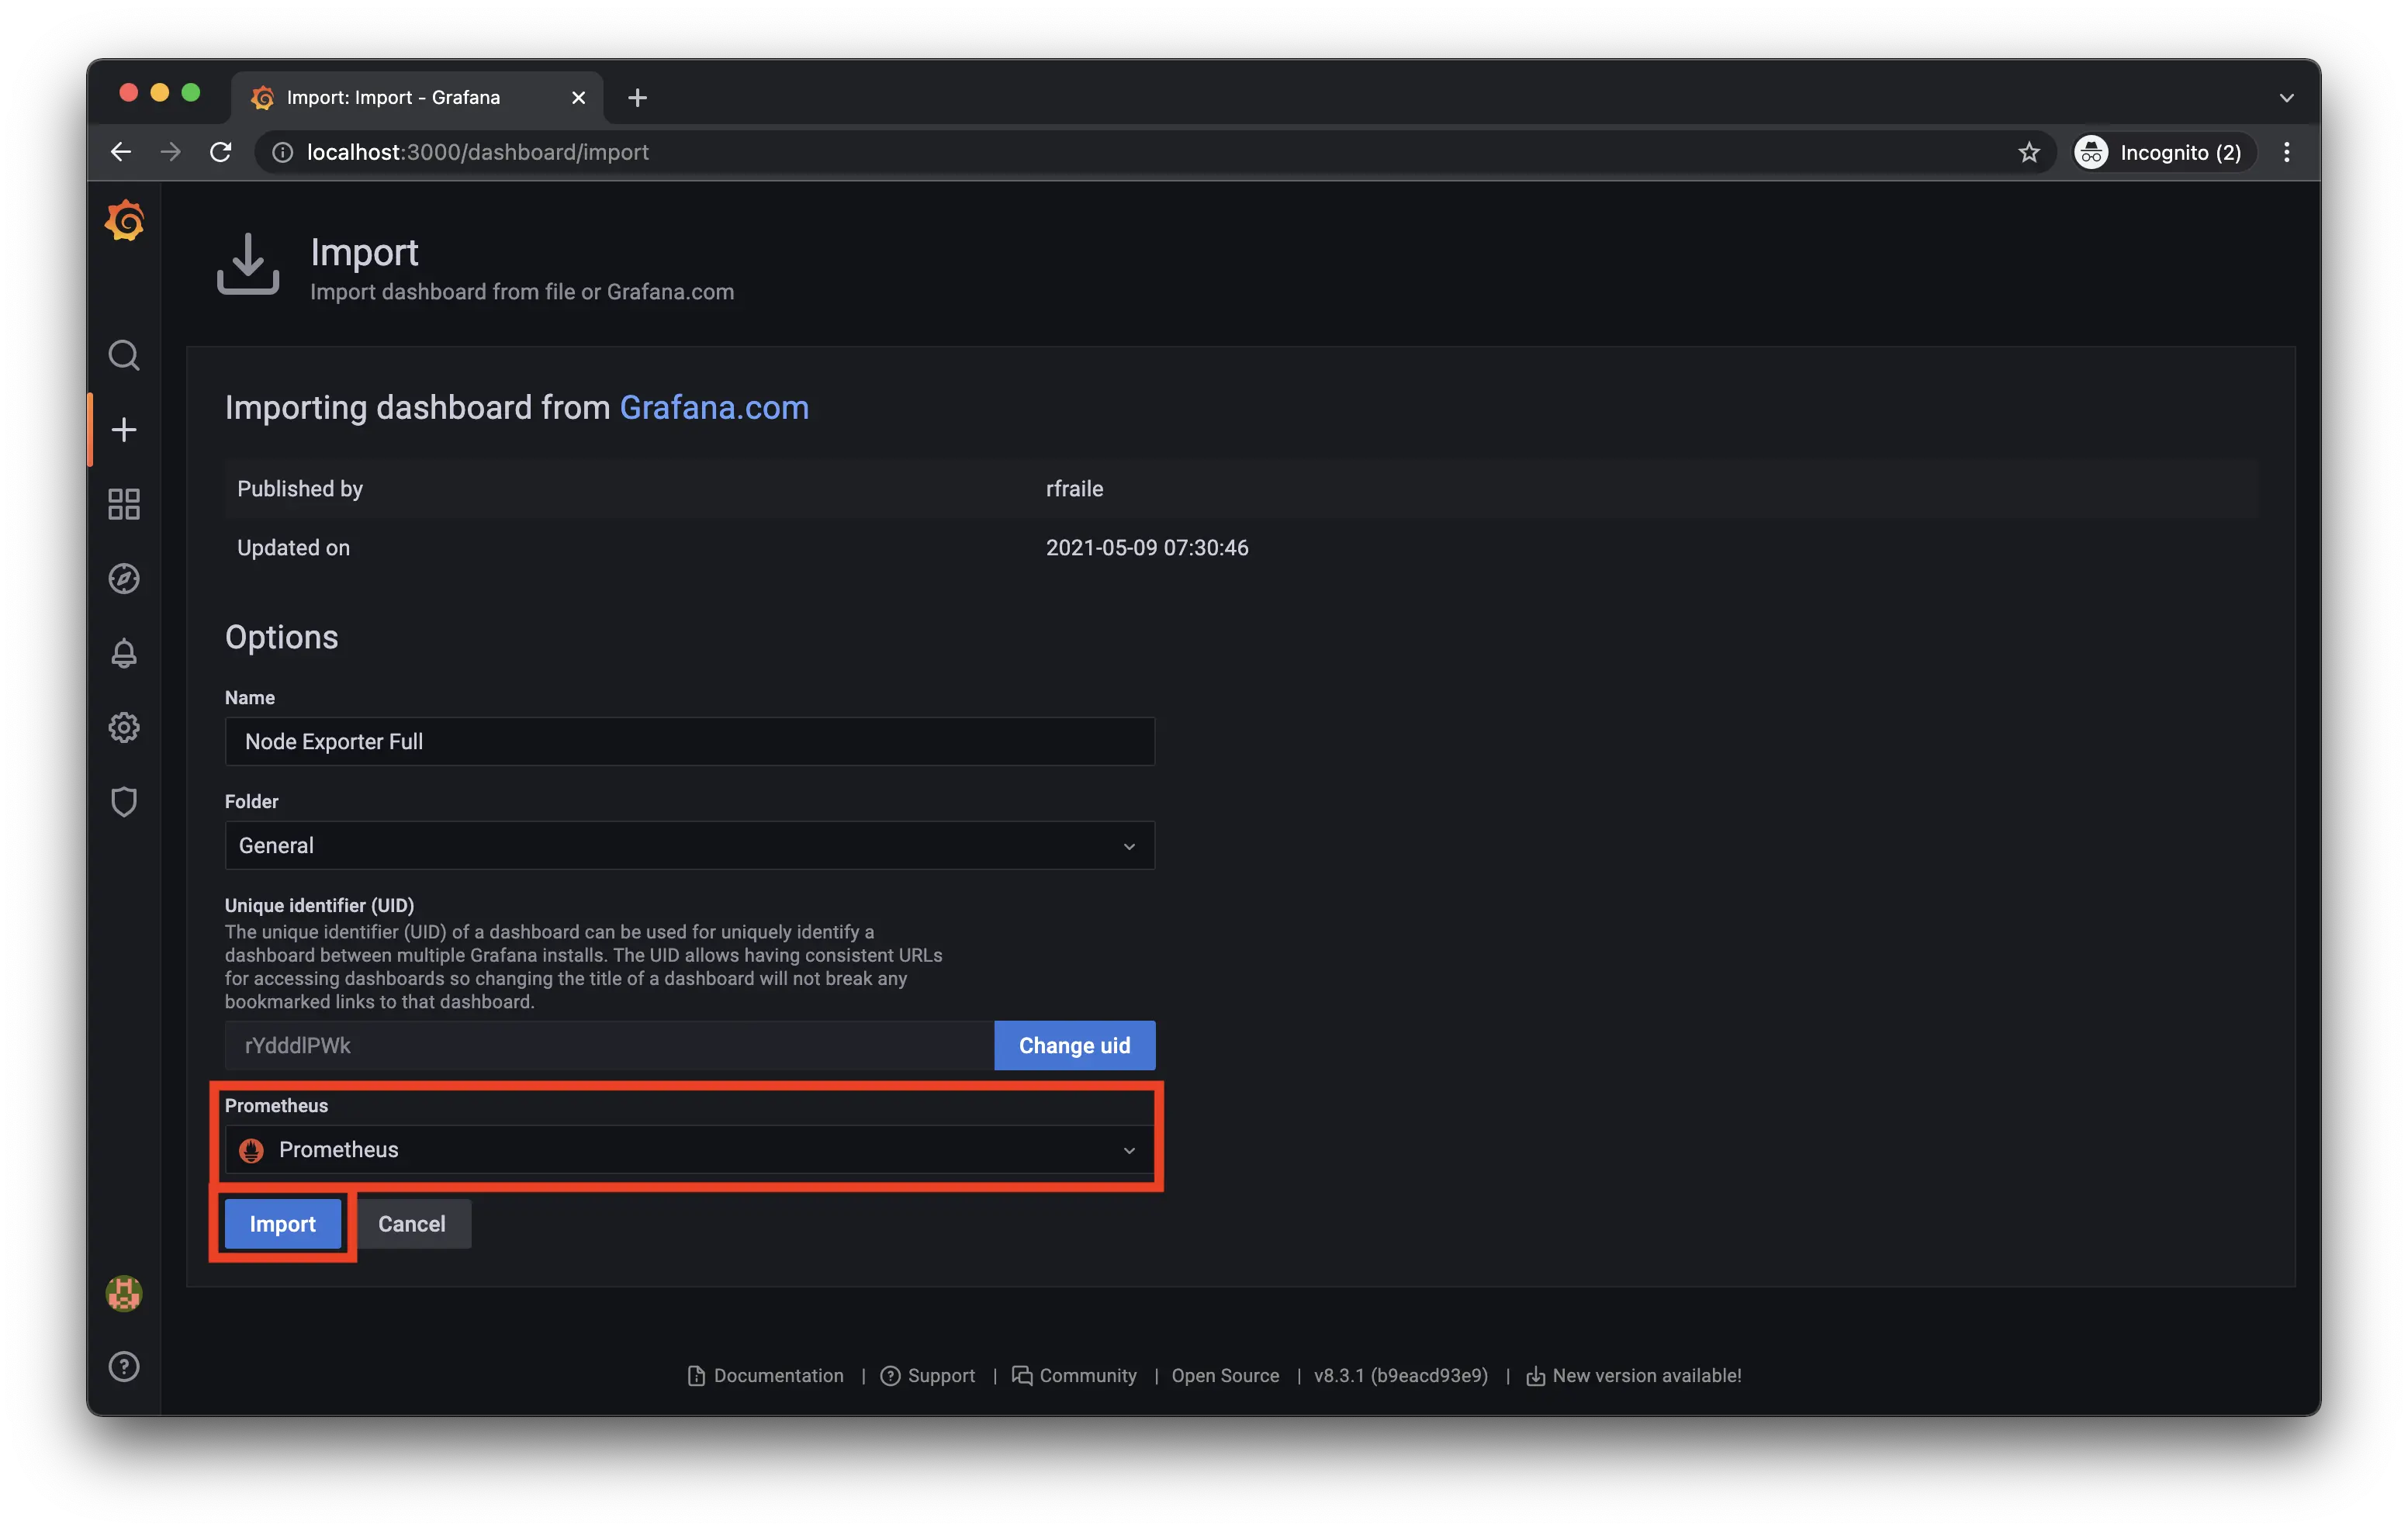
データの取得先としてPrometheusを選択して、「Import」をクリックします。
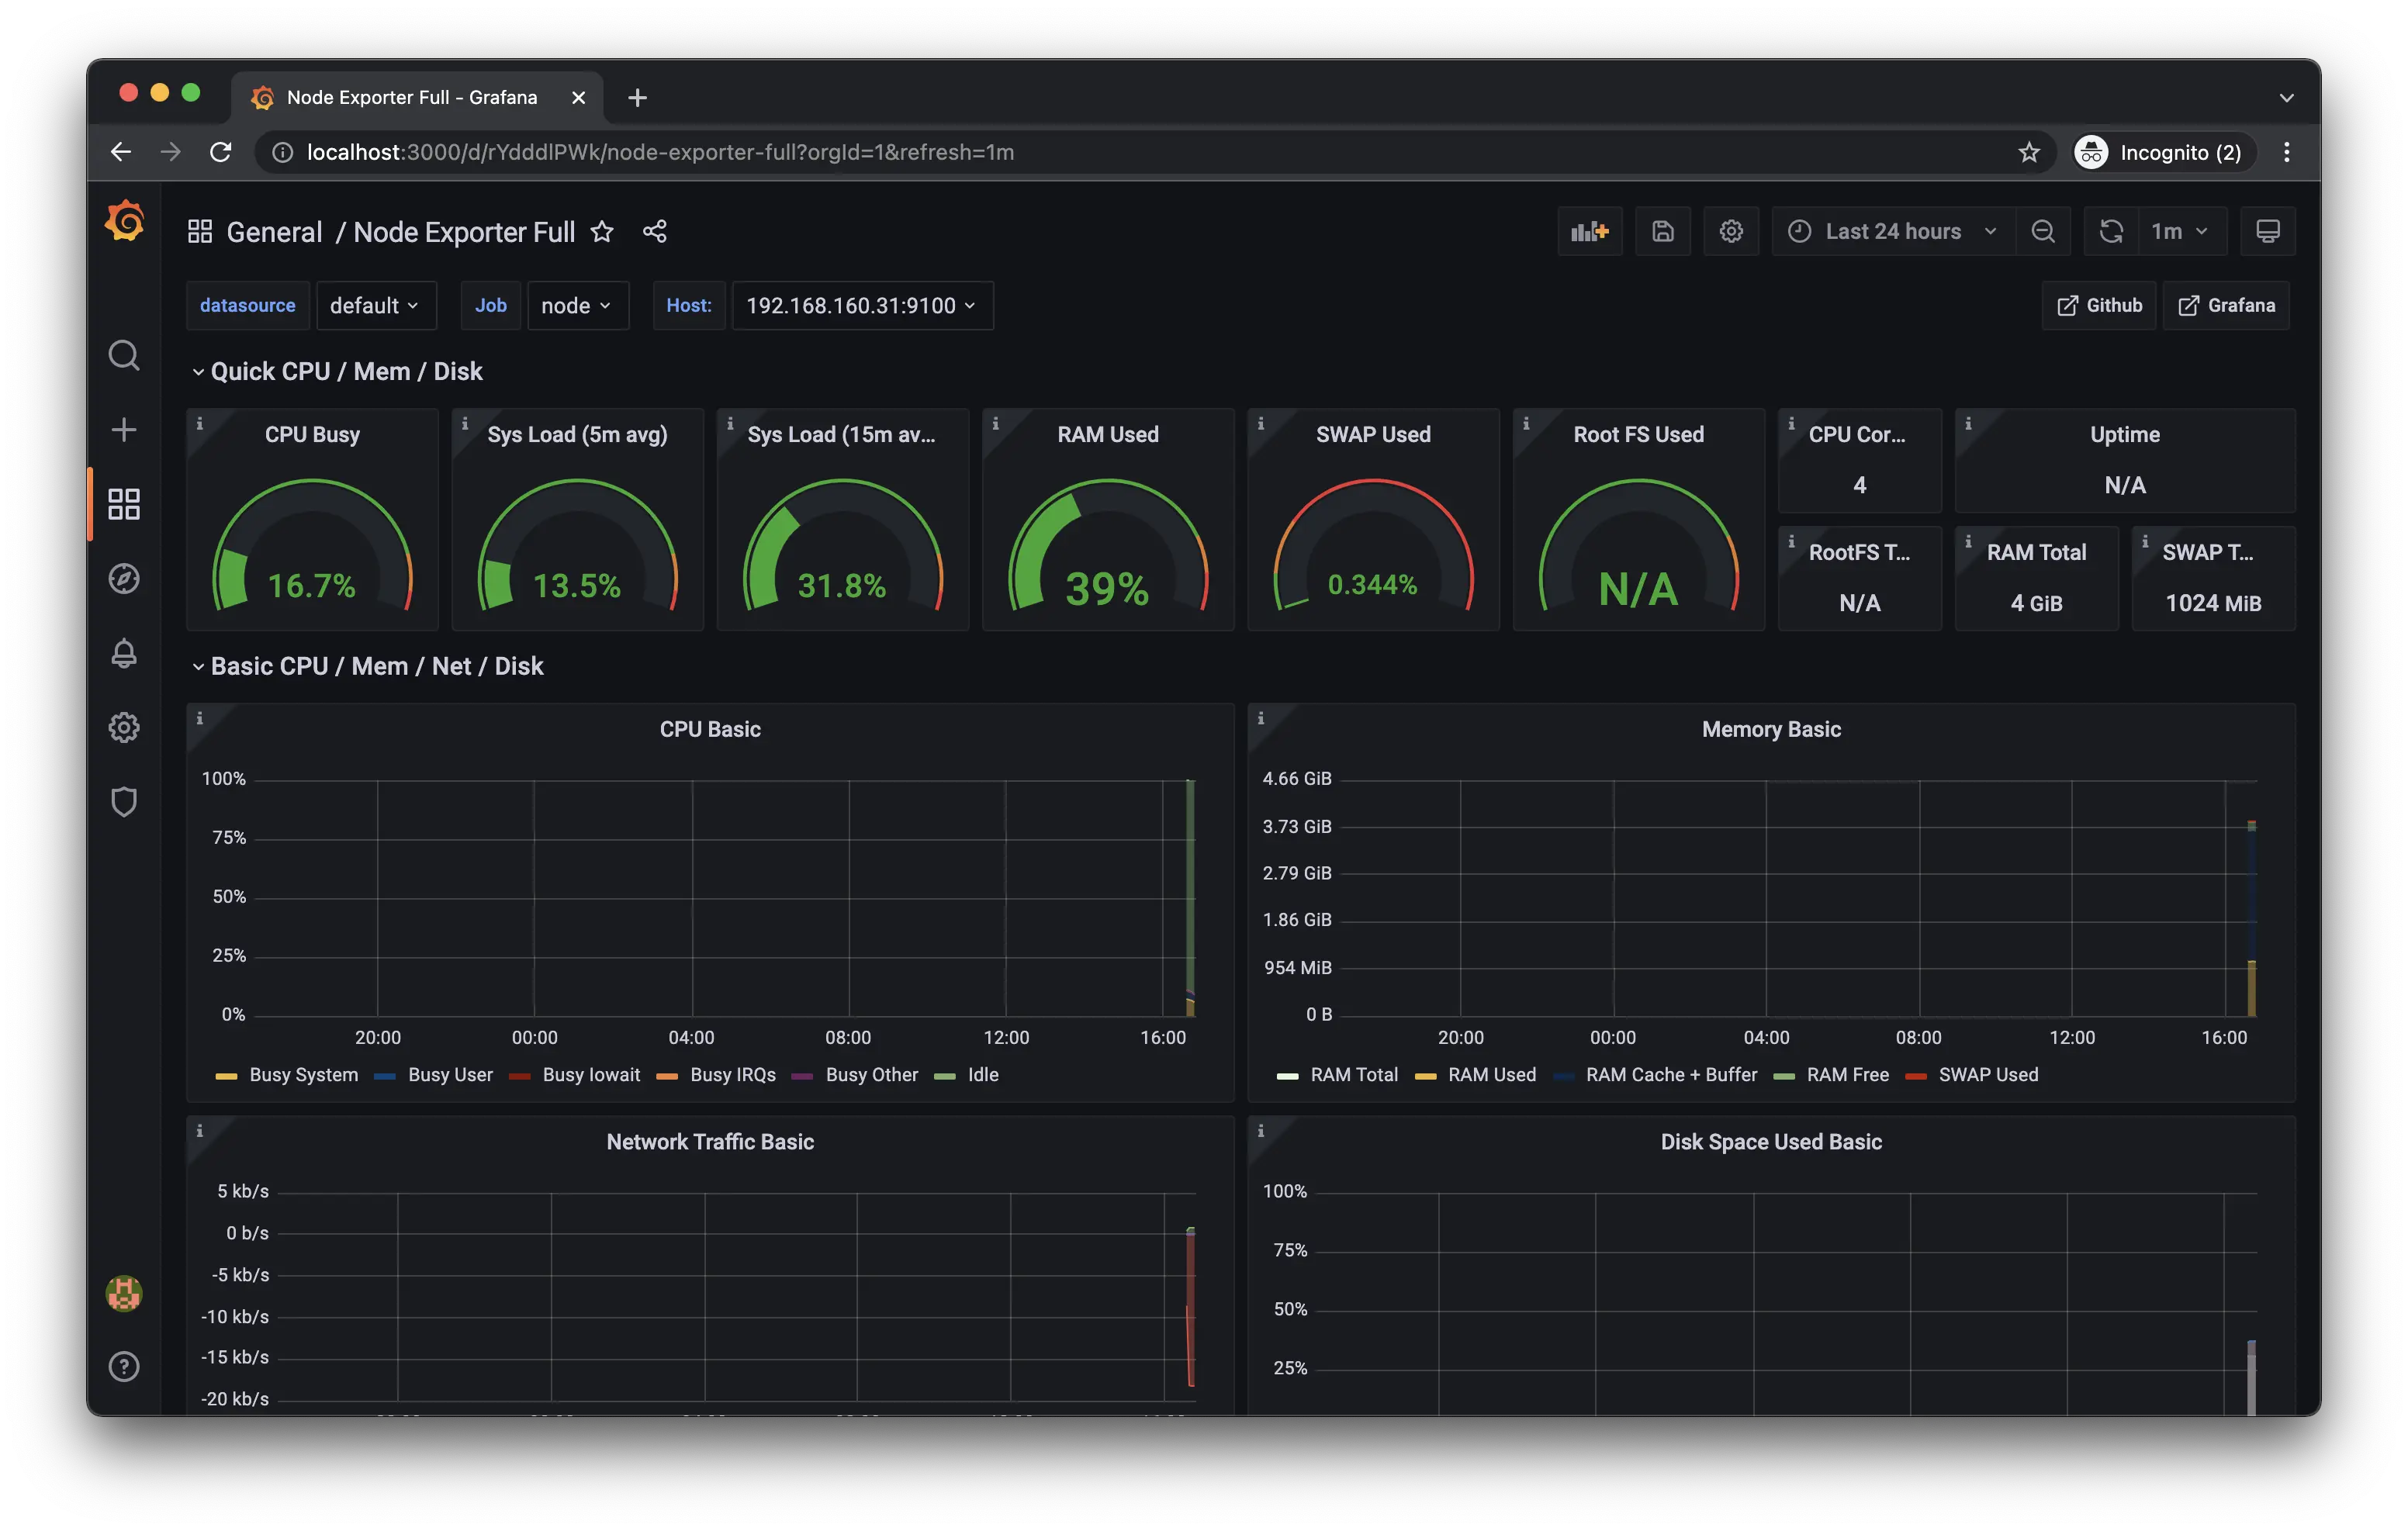
これでダッシュボードのインポートが完了です。
まとめ
- GrafanaでPrometheusのメトリクスの可視化ができる
- ダッシュボードのインポートができる
参考
- Documentation | Grafana Labs
- With Grafana | Grafana Labs
- Overview | Prometheus
- grafana/grafana - Docker Image | Docker Hub
- Dashboards | Grafana Labs
\ この記事が役に立ったと思ったら、サポートお願いします! /

関連記事

【Elastic Stack】Logstash設定のきほん

PrometheusからIstioのメトリクスを確認する