はじめに
Logstashのパイプラインの設定について、基本的な部分を紹介したいと思います。
Logstash
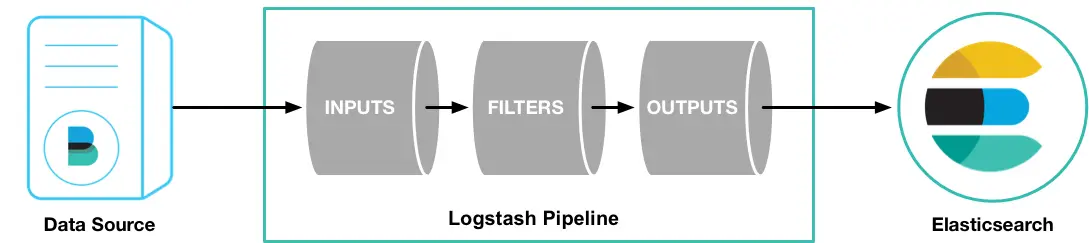
Logstashは、Elastic Stackの一つで、ログを処理するパイプラインになります。つまり、ログを受け取って、何かしらの処理をして、どこかに送ることができます。
Logstashの処理は下記の流れになります。
 Elasticのドキュメントより
inputでデータを受け取り、filterでデータを処理し、outputでデータを宛先に送ります。
設定ファイル
Logstashの基本的な設定ファイルについて紹介します。
構造
設定ファイルの基本的な構造は下記のようになります。
1input {
2  ...
3}
4
5filter {
6  ...
7}
8
9output {
10  ...
11}input、filter、outputから構成されます。inputとoutputは必須で、filterはオプションです。
それぞれプラグインが用意されていて、さまざまなデータに対応できるようになっています。
使えるデータの型については、公式ドキュメントを参照してください。

Structure of a pipeline | Logstash
A Logstash pipeline config file has a separate section for each type of plugin you want to add to the event processing pipeline. For example: Each section...
input
inputは、データを取得するのに使われます。
よく使われるプラグインには、下記のようなものるあります。
file: ファイルからデータを取得syslogsyslogからデータを取得beats: Beatsからデータを取得
Input plugins | Logstash Plugins
An input plugin enables a specific source of events to be read by Logstash. The following input plugins are available below. For a list of Elastic supported...
filter
filterは、受け取ったデータに対してさまざまな処理を行います。
よく使われるプラグインには、下記のようなものるあります。
grok: 任意のテキストをパースし構造化mutate: フィールドの変換drop: イベントの削除
Filter plugins | Logstash Plugins
A filter plugin performs intermediary processing on an event. Filters are often applied conditionally depending on the characteristics of the event. The...
output
outputは、データを特定の宛先に送ります。
よく使われるプラグインには、下記のようなものるあります。
elasticsearch: Elasticsearchに送信file: ファイルに書き込み
Output plugins | Logstash Plugins
An output plugin sends event data to a particular destination. Outputs are the final stage in the event pipeline. The following output plugins are available...
試してみる
簡単な例で試してみたいと思います。
ローカル環境の準備
下記で紹介しているdocker-elkリポジトリを活用します。
Docker ComposeでElastic Stackをローカルに構築
はじめに **Docker Composeを使って、ローカルにElastic StackのうちE
GitHub - deviantony/docker-elk: The Elastic stack (ELK) powered by Docker and Compose.
The Elastic stack (ELK) powered by Docker and Compose. - deviantony/docker-elk
まずはリポジトリをクローンしてきます。
1git clone [email protected]:deviantony/docker-elk.git
2cd docker-elk次に、filebeatを利用するので、docker-elk/extensions/filebeat/config/filebeat.ymlの設定を下記のように変更して、filebeatからLogstashに送信されるようにします。
1## Filebeat configuration
2## https://github.com/elastic/beats/blob/master/deploy/docker/filebeat.docker.yml
3#
4
5filebeat.config:
6  modules:
7    path: ${path.config}/modules.d/*.yml
8    reload.enabled: false
9
10filebeat.autodiscover:
11  providers:
12    # The Docker autodiscover provider automatically retrieves logs from Docker
13    # containers as they start and stop.
14    - type: docker
15      hints.enabled: true
16
17processors:
18  - add_cloud_metadata: ~
19
20output.logstash: # 宛先をLogstashに変更
21  hosts: ["logstash:5044"]
22
23## HTTP endpoint for health checking
24## https://www.elastic.co/guide/en/beats/filebeat/current/http-endpoint.html
25#
26
27http.enabled: true
28http.host: 0.0.0.0
Logstashの設定
次にLogstashの設定を変更します。
今回はシンプルに、inputでBeatsからデータを取得して、filterでフィールドを追加して、outputでElasticsearchに送信する設定にしました。
1input { # Beatsからデータ取得
2  beats {
3    port => 5044
4  }
5}
6
7filter { # フィールド追加
8  mutate {
9    add_field => {
10      "hoge" => "foo"
11    }
12  }
13}
14
15output { # Elasticsearchに送信
16  elasticsearch {
17    hosts => "elasticsearch:9200"
18    user => "logstash_internal"
19    password => "${LOGSTASH_INTERNAL_PASSWORD}"
20  }
21}
Elastic Stackの起動
filebeatとLogstashの設定変更が完了したら、Docker ComposeでElastic Stackを起動させます。
1docker-compose -f docker-compose.yml -f extensions/filebeat/filebeat-compose.yml up -d動作確認
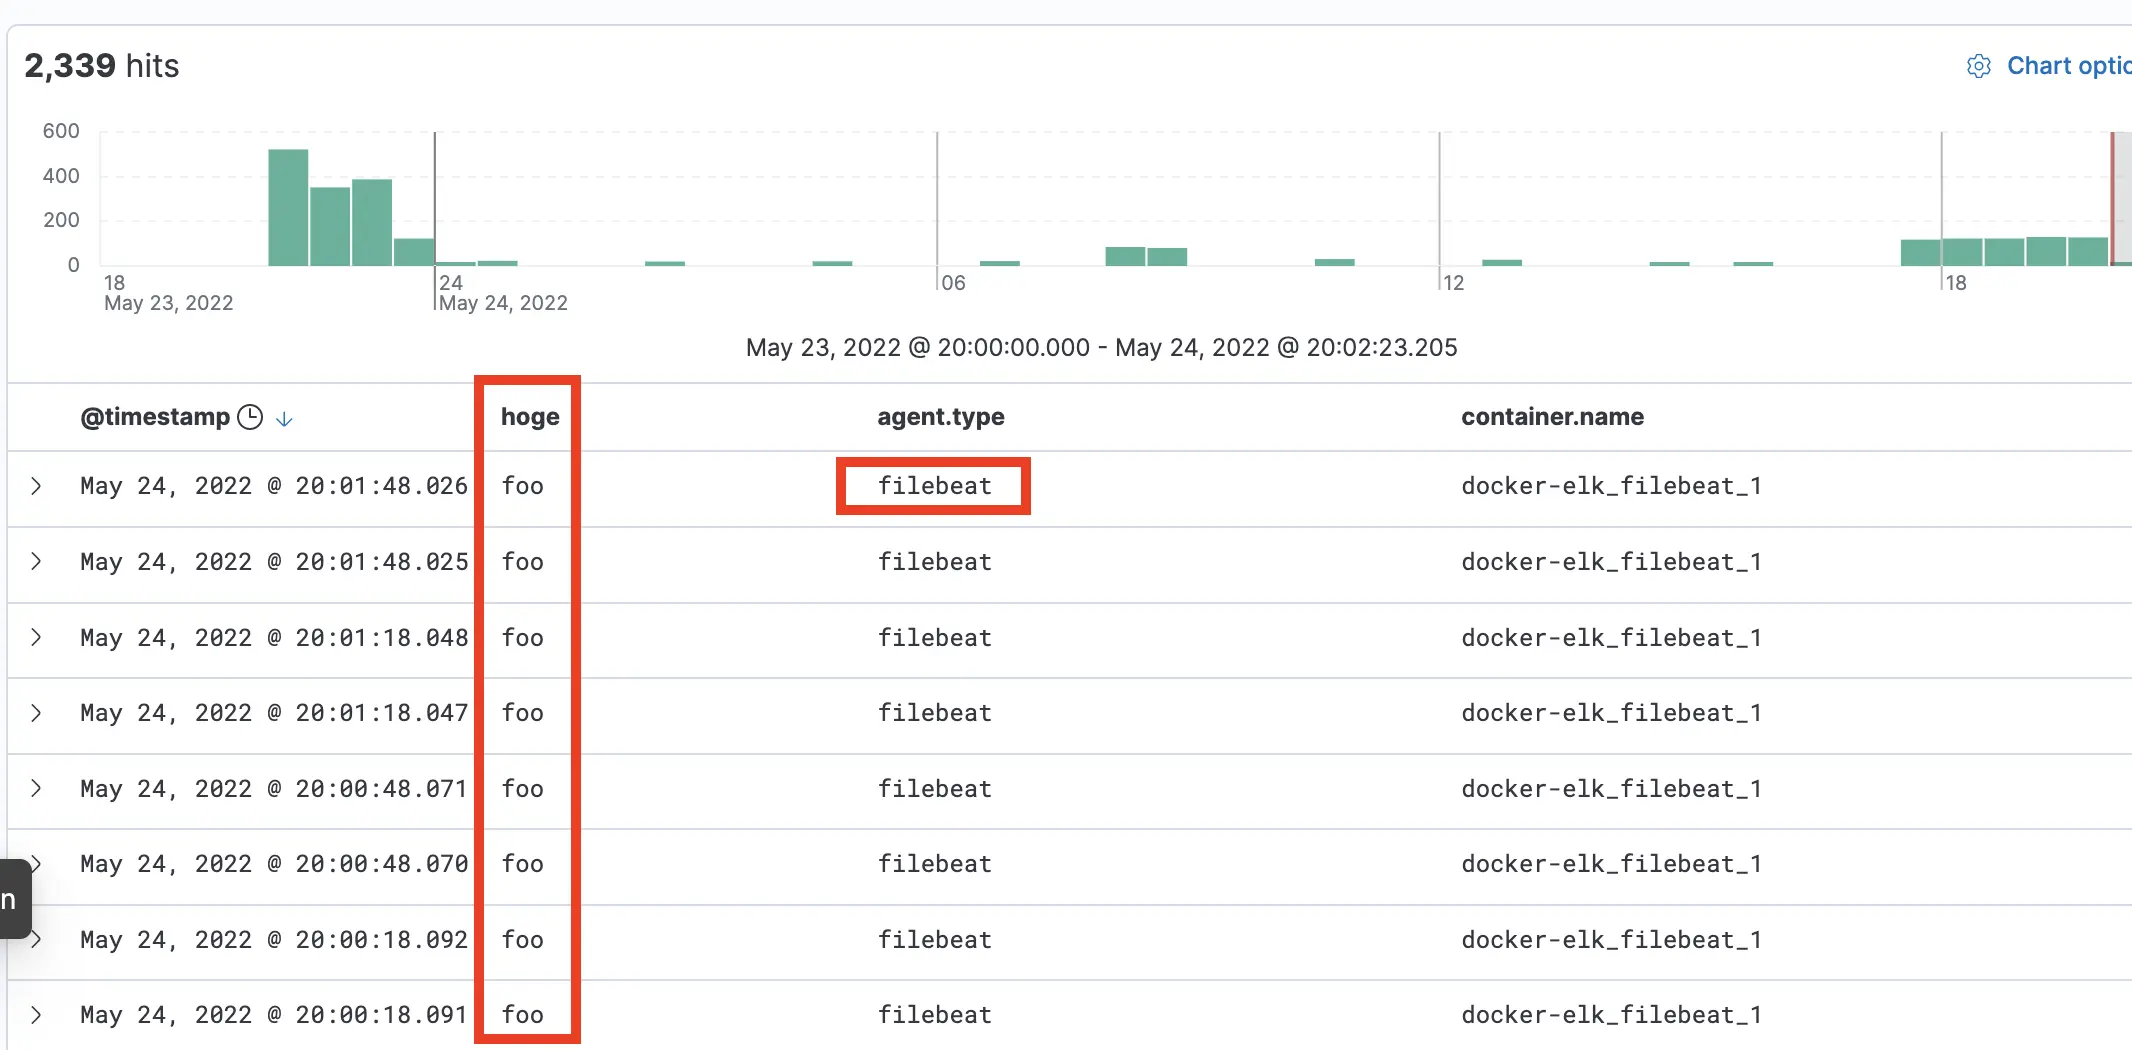
http://localhost:5601にアクセスして、Kibanaからログを確認してみます。
filebeatのログがフィールドが追加されて、送信されていることが確認できます。
参考
- Welcome to Elastic Docs | Elastic
- Logstash Reference [8.2] | Elastic
- Stashing Your First Event | Logstash Reference [master] | Elastic
- Input plugins | Logstash Reference [8.2] | Elastic
- Filter plugins | Logstash Reference [8.2] | Elastic
- Output plugins | Logstash Reference [8.2] | Elastic
- deviantony/docker-elk: The Elastic stack (ELK) powered by Docker and Compose.
\ この記事が役に立ったと思ったら、サポートお願いします! /

関連記事

【Senryでエラー監視】Pythonのエラーを確認してみる
【Prometheus】ローカルでPromxyを動かしながら理解する