【Helm】helmfileでPrometheusとkube-state-metricsを試す
はじめに
helmfileを使ってPrometheusとkube-state-metricsをローカルに構築し、いろいろ試せる環境を作っていきます。
helmfileについては下記で解説しています。
【Helm】helmfile使ってみる
:::affiliate-message 本ページはAmazonアフィリエイトのリンクを含みます。
用意するファイルとディレクトリ構成
用意するファイルとディレクトリ構成は下記の通りになります。
1.
2├── helmfile.yaml
3└── values.yaml
helmfile.yamlの作成
helmfile.yamlを作成します。
利用するチャートは下記のprometheus-community/prometheusを使います。
helm-charts/charts/prometheus at main · prometheus-community/helm-charts
Prometheus community Helm charts. Contribute to prometheus-community/helm-charts development by creating an account on GitHub.
1releases:
2  - name: prometheus
3    namespace: default
4    chart: prometheus-community/prometheus
5    values:
6      - ./values.yaml
values.yamlの作成
values.yamlを作成します。
不要なコンポーネントはデプロイせず、kube-state-metricsのみをデプロイするように設定します。
1alertmanager:
2  enabled: false
3kube-state-metrics:
4  enabled: true
5prometheus-pushgateway:
6  enabled: false
7prometheus-node-exporter:
8  enabled: false
helmfileの適用
Prometheusのチャートがあるリポジトリを追加します。
1helm repo add prometheus-community https://prometheus-community.github.io/helm-charts
2helm repo update
helmfileでチャートのインストールをします。
1helmfile applyデプロイされたものを確認します。
1❯ helm list
2NAME            NAMESPACE       REVISION        UPDATED                                 STATUS          CHART                   APP VERSION
3prometheus      default         2               2022-06-25 09:29:55.647289 +0900 JST    deployed        prometheus-15.10.1      2.34.0
4
5❯ kubectl get pod,svc
6NAME                                                 READY   STATUS    RESTARTS   AGE
7pod/prometheus-kube-state-metrics-5c9f756cf8-kv6cm   1/1     Running   0          3h34m
8pod/prometheus-server-7d57c9697f-nxcgx               2/2     Running   0          3h34m
9
10NAME                                    TYPE        CLUSTER-IP       EXTERNAL-IP   PORT(S)    AGE
11service/prometheus-kube-state-metrics   ClusterIP   10.108.204.201   <none>        8080/TCP   3h34m
12service/prometheus-server               ClusterIP   10.98.9.132      <none>        80/TCP     3h34m
Prometheusからkube-state-metricsを確認
ローカルからprometheus-serverにアクセスできるようにポートフォワードします。
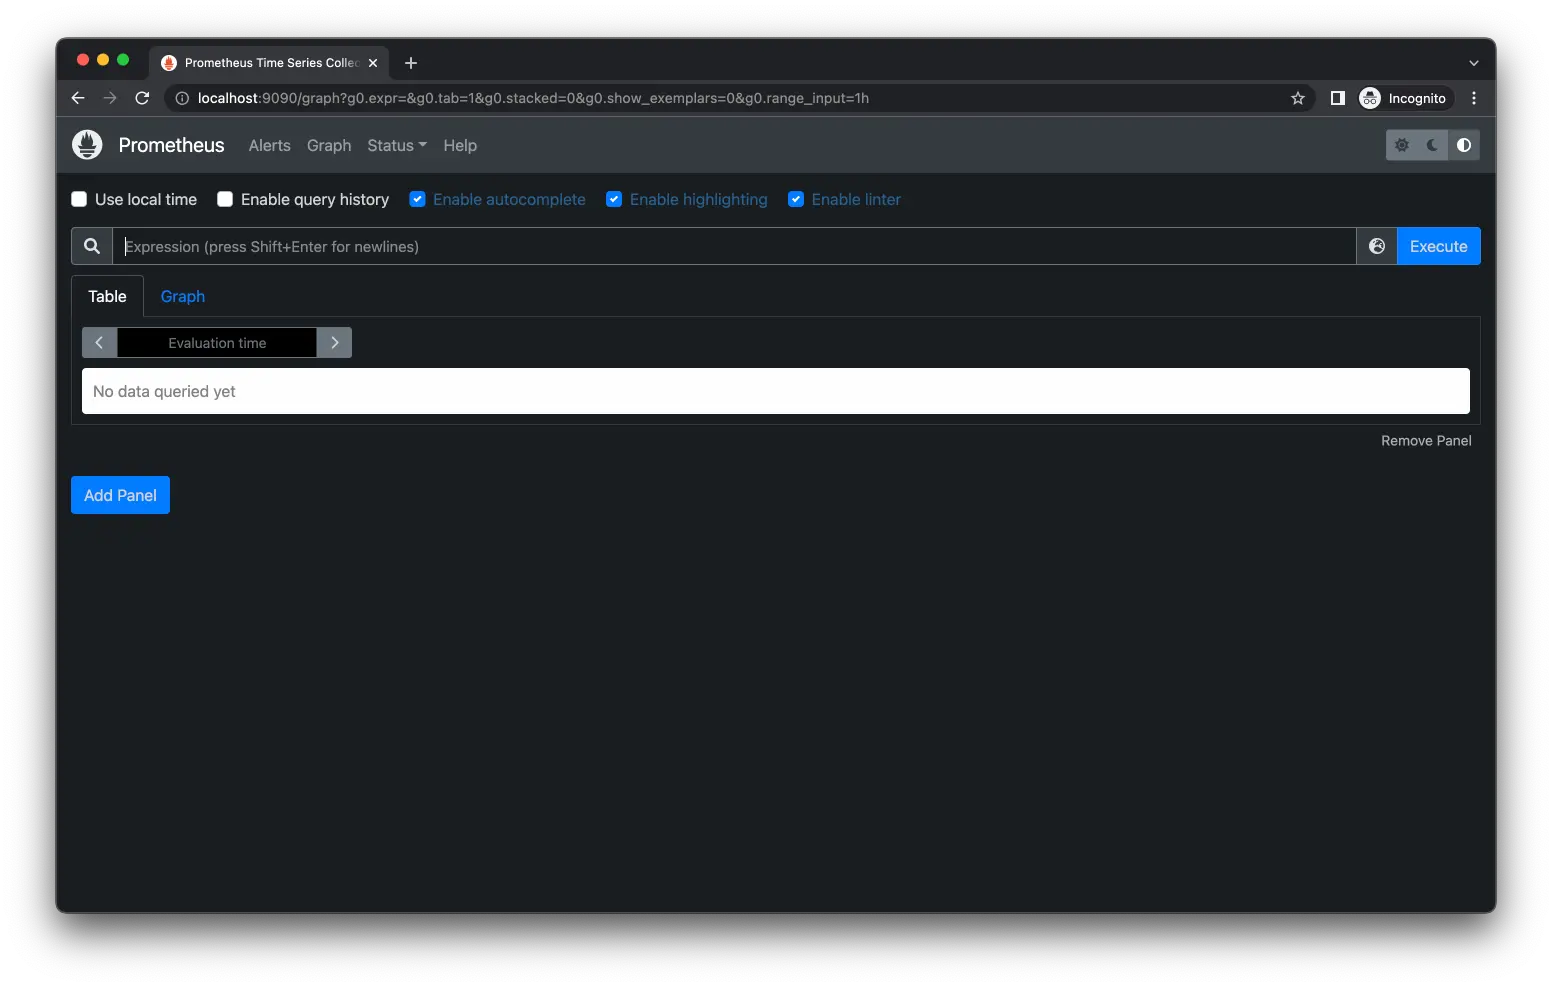
1kubectl port-forward svc/prometheus-server 9090:80localhost:9090からPrometheusにアクセスできるようになります。
また、kube-state-metricsを確認するために、kube-state-metricsもポートフォワードします。
1kubectl port-forward svc/prometheus-kube-state-metrics 8080:8080curlコマンドやブラウザからlocalhost:8080/metricsにアクセスすると、メトリクスの一覧が確認できます。
1❯ curl localhost:8080/metrics
2# HELP kube_certificatesigningrequest_annotations Kubernetes annotations converted to Prometheus labels.
3# TYPE kube_certificatesigningrequest_annotations gauge
4# HELP kube_certificatesigningrequest_labels Kubernetes labels converted to Prometheus labels.
5# TYPE kube_certificatesigningrequest_labels gauge
6# HELP kube_certificatesigningrequest_created Unix creation timestamp
7# TYPE kube_certificatesigningrequest_created gauge
8# HELP kube_certificatesigningrequest_condition The number of each certificatesigningrequest condition
9# TYPE kube_certificatesigningrequest_condition gauge
10# HELP kube_certificatesigningrequest_cert_length Length of the issued cert
11# TYPE kube_certificatesigningrequest_cert_length gauge
12# HELP kube_configmap_annotations Kubernetes annotations converted to Prometheus labels.
13# TYPE kube_configmap_annotations gauge
14kube_configmap_annotations{namespace="default",configmap="kube-root-ca.crt"} 1
15kube_configmap_annotations{namespace="kube-node-lease",configmap="kube-root-ca.crt"} 1
16kube_configmap_annotations{namespace="kube-system",configmap="extension-apiserver-authentication"} 1
17kube_configmap_annotations{namespace="kube-system",configmap="kubeadm-config"} 1
18kube_configmap_annotations{namespace="kube-system",configmap="kubelet-config"} 1
19kube_configmap_annotations{namespace="default",configmap="prometheus-server"} 1
20kube_configmap_annotations{namespace="kube-public",configmap="cluster-info"} 1
21kube_configmap_annotations{namespace="kube-public",configmap="kube-root-ca.crt"} 1
22
23...
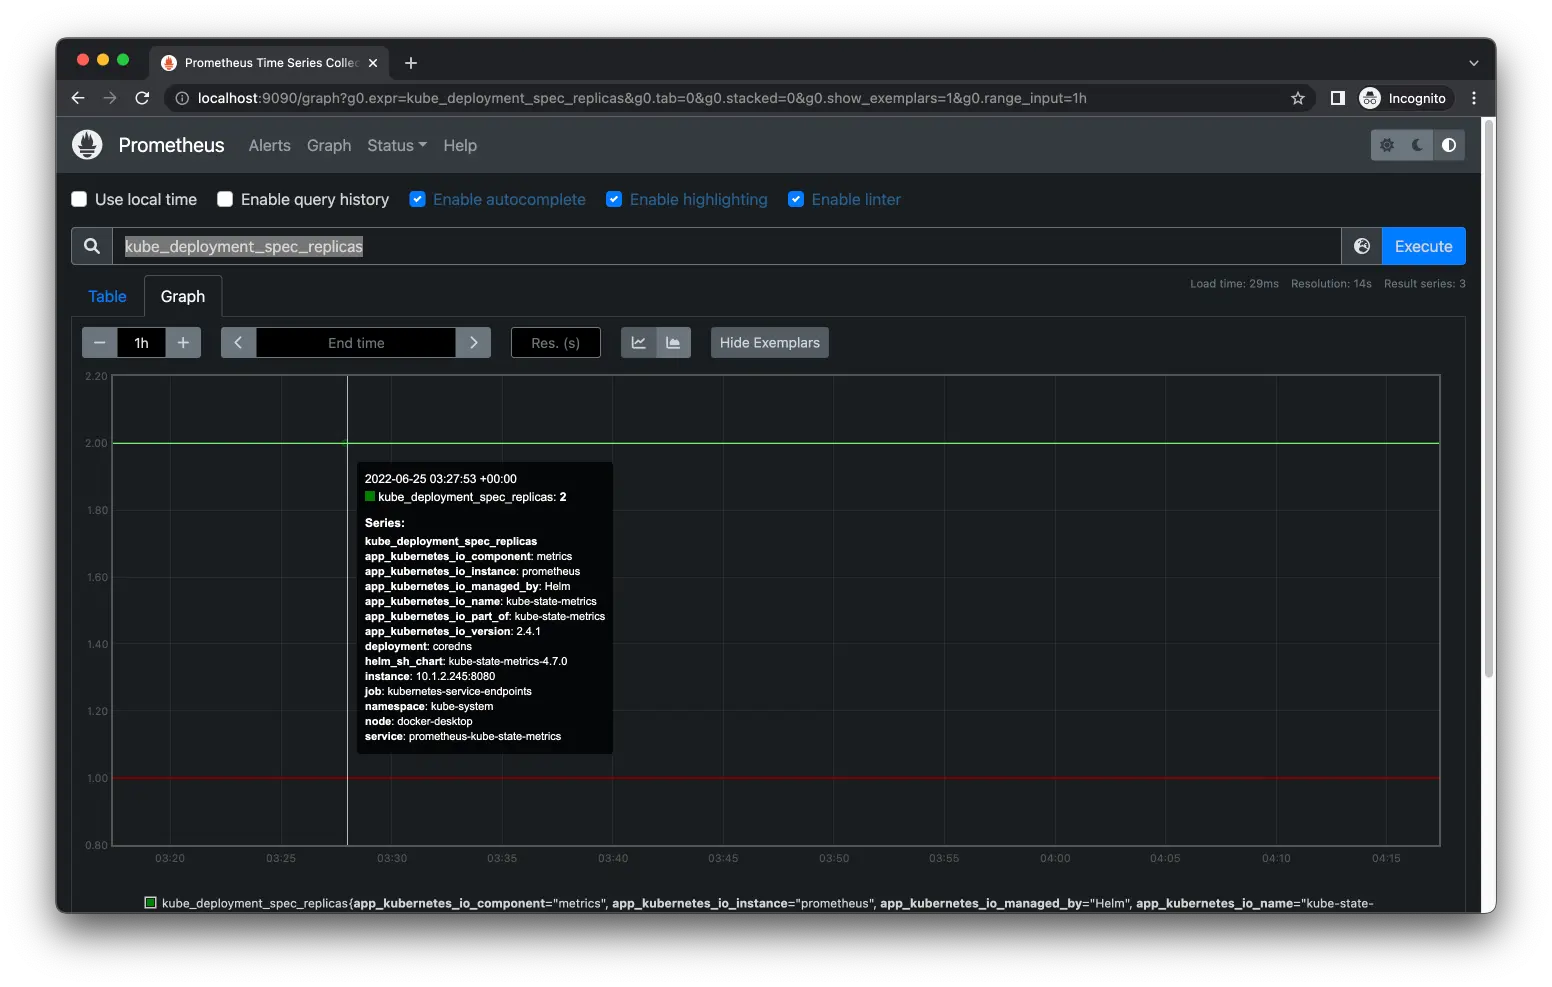
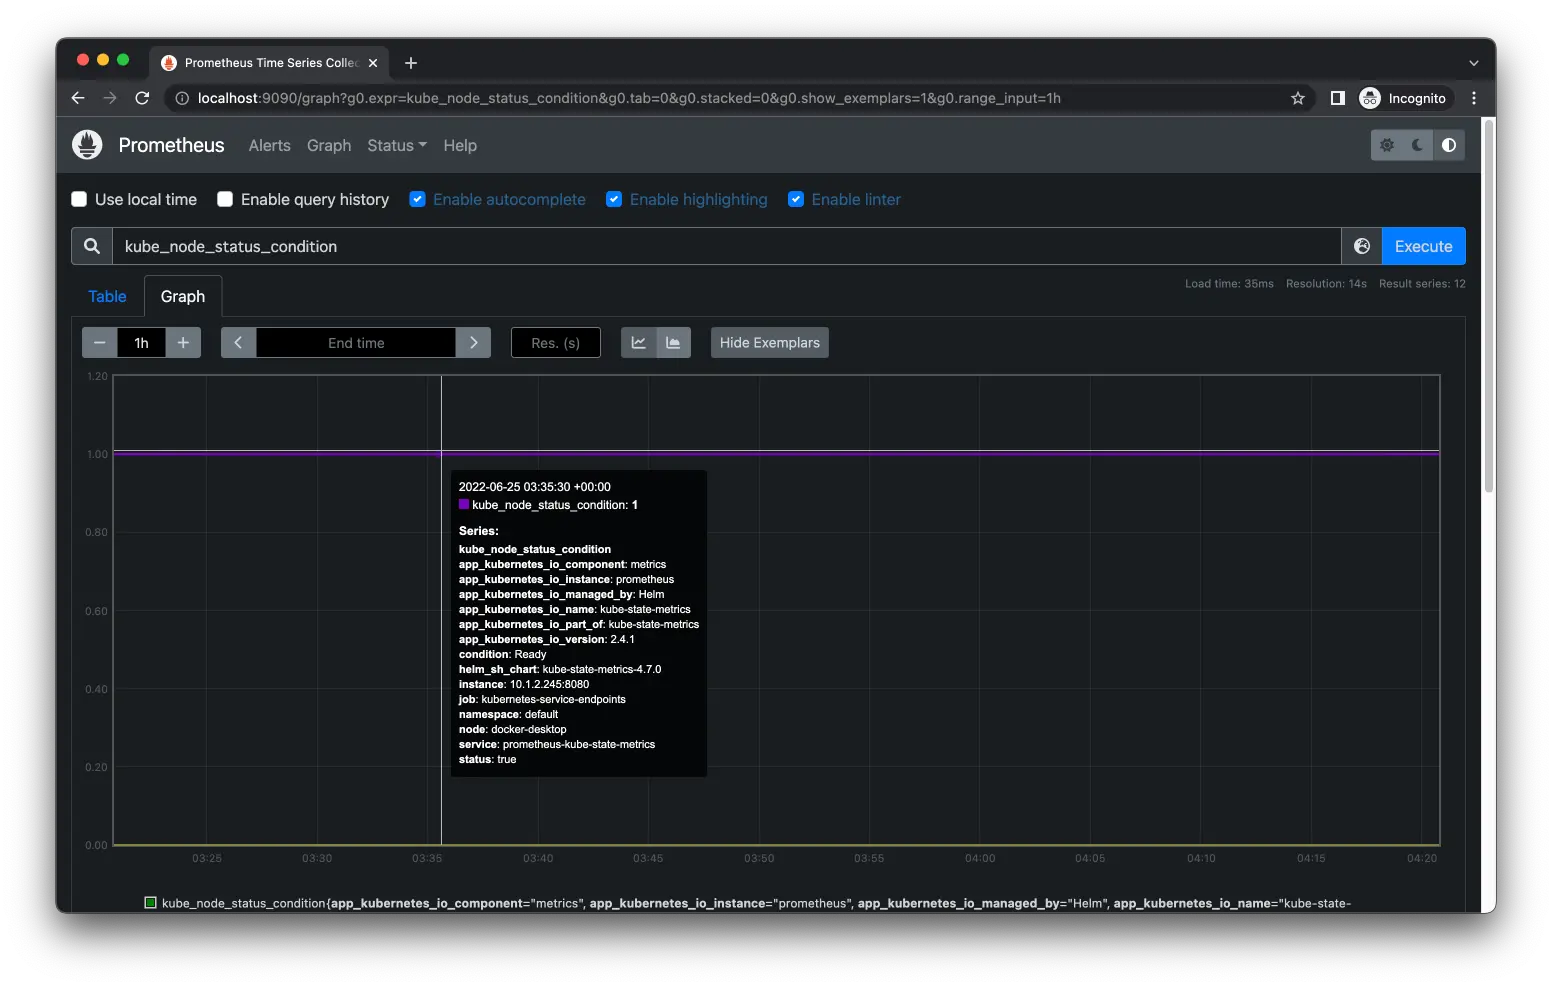
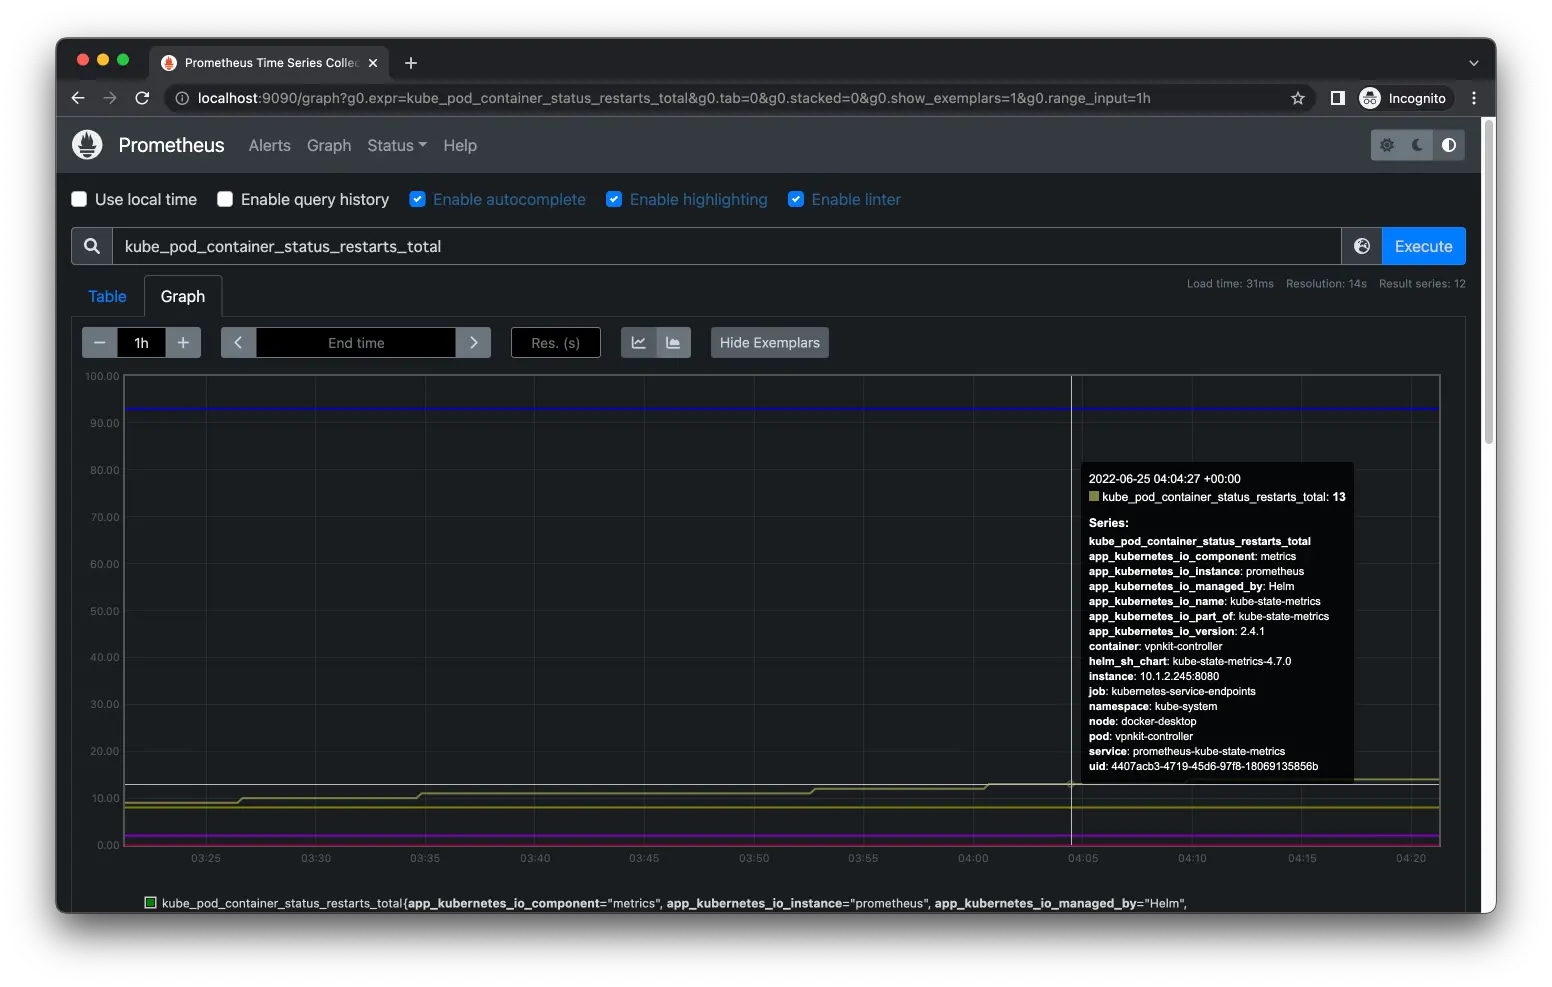
24Prometheusからいくつかメトリクスを確認してみます。
kube_deployment_spec_replicas: Deploymentのレプリカ数
kube_node_status_condition: ノードの状態
kube_pod_container_status_restarts_total: Podのリスタート回数
片付け
使い終わった場合は下記で削除します。
1helmfile delete参考
\ この記事が役に立ったと思ったら、サポートお願いします! /

関連記事
【Prometheus】PromQLのand/or/unlessを理解する
【Prometheus】Alertmanagerでアラートを一時的に停止する
Docker ComposeでElastic Stackをローカルに構築