はじめに
seabornでsubplotを使って、複数のグラフを並べて描画する方法を紹介します。
テンプレ
テンプレとなるコードは下記の通りです。
ここでは4行3列の12個のグラフを表示するパターンになっています。
1import seaborn as sns
2import matplotlib.pyplot as plt
3sns.set()
4
5cols = df.columns
6fig, axes = plt.subplots(4, 3, figsize=(50, 50))
7axes = axes.ravel()
8
9for col, ax in zip(cols, axes):
10    sns.histplot(df[col], ax=ax)
11
12plt.show()
文字のサイズを大きくしたい場合は、下記のようにします。
1sns.set(font_scale=2)titanicデータで試す
kaggleのtitanicデータを使って実際にグラフを描画してみます。

Titanic - Machine Learning from Disaster
Start here! Predict survival on the Titanic and get familiar with ML basics
1import seaborn as sns
2import matplotlib.pyplot as plt
3import pandas as pd
4sns.set(font_scale=2)
5
6df = pd.read_csv('../input/titanic/train.csv')
7
8cols = df.columns
9fig, axes = plt.subplots(4, 3, figsize=(50, 50))
10axes = axes.ravel()
11
12for col, ax in zip(cols, axes):
13    sns.histplot(df[col], ax=ax)
14
15plt.show()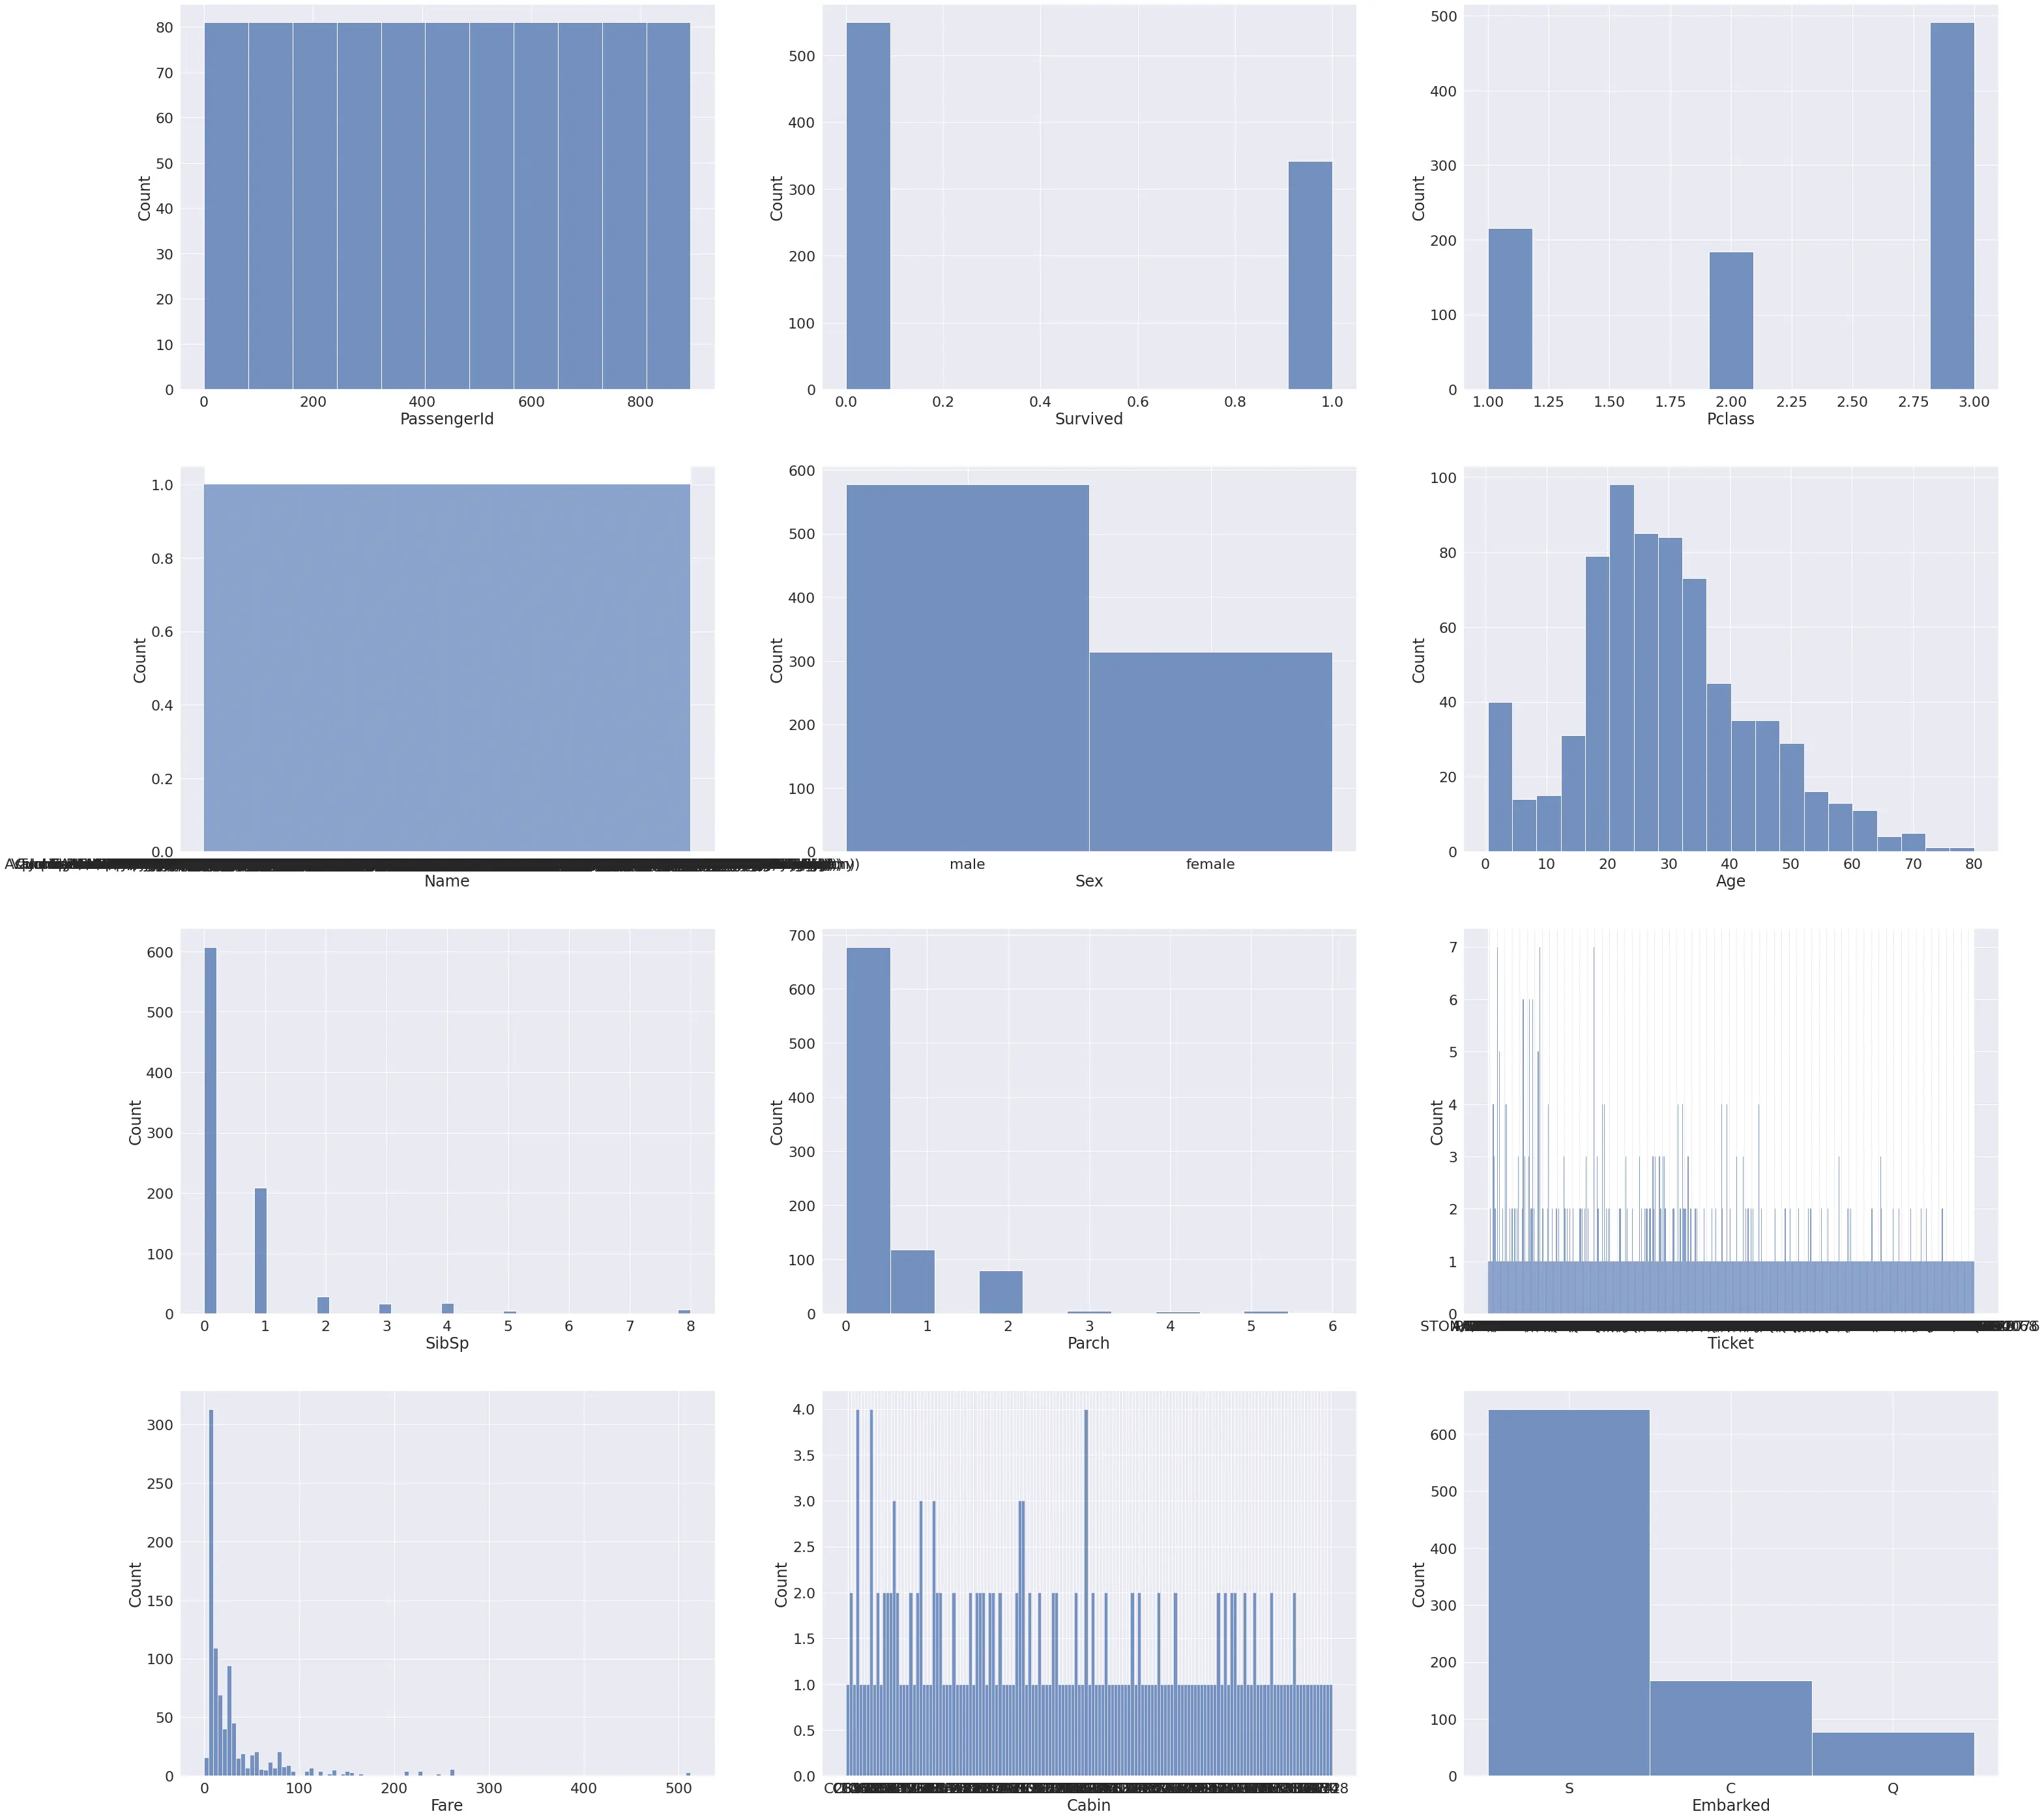
参考
Support
\ この記事が役に立ったと思ったら、サポートお願いします! /

Share
関連記事

Cobraを使ってさっと簡単なCLIを作ってみる
2024.01.26

Backstageのバージョンをアップグレードする
2025.03.15

【Backstage】GitHubでの認証を試してみる
2024.08.15

【Typescript】Reactでテキストをコピーするボタンを実装する
2023.07.30