はじめに
ローカルでPrometheusとIstioを動かして、PrometheusからIstioのメトリクスを確認してみます。
Istioのメトリクス
まずは、簡単にIstioの標準的なメトリクスについて紹介します。
標準的なメトリクスには、HTTP, HTTP/2, gRPCのトラフィックから生成されるメトリクスとTCPのトラフィックから生成されるメトリクスがあります。
HTTP, HTTP/2, gRPC
| メトリクス | タイプ | 詳細 |
|---|---|---|
istio_requests_total | COUNTER | リクエスト数 |
istio_request_duration_milliseconds | DISTRIBUTION | リクエストの処理時間 |
istio_request_bytes | DISTRIBUTION | リクエストのサイズ |
istio_response_bytes | DISTRIBUTION | レスポンスのサイズ |
istio_request_messages_total | COUNTER | gRPCのリクエストメッセージ数 |
istio_response_messages_total | COUNTER | gRPCのレスポンスメッセージ数 |
DISTRIBUTIONタイプのメトリクスは、Prometheusから確認する場合、_bucket、 _count、 _sumがついています。
TCP
| メトリクス | タイプ | 詳細 |
|---|---|---|
istio_tcp_sent_bytes_total | COUNTER | 送信バイト数 |
istio_tcp_received_bytes_total | COUNTER | 受信バイト数 |
istio_tcp_connections_opened_total | COUNTER | OpenなTCPコネクション |
istio_tcp_connections_closed_total | COUNTER | CloseなTCPコネクション |
ローカルで試す
実際にローカルでPrometheusとIstioを動かして、メトリクスを確認していきます。
用意するファイルは下記の通りです。
1.
2├── prometheus
3│   ├── helmfile.yaml
4│   └── prometheus.yaml
5├── istio.yaml
6├── deployment.yaml
7└── service.yaml
HelmでPrometheusのデプロイ
まずは、Helmとhelmfileを使ってPrometheusをデプロイします。
prometheus/helmfile.yamlは下記の通りです。monitoring Namespaceにデプロイされるようにしています。
1releases:
2  - name: prometheus
3    namespace: monitoring
4    chart: prometheus-community/prometheus
5    values:
6      - ./prometheus.yaml
利用しているチャートはこちらです。
helm-charts/charts/prometheus at main · prometheus-community/helm-charts
Prometheus community Helm charts. Contribute to prometheus-community/helm-charts development by creating an account on GitHub.
prometheus/prometheus.yamlは下記の通りです。Prometheus以外のものはデプロイしないようにしています。
1alertmanager:
2  enabled: false
3kube-state-metrics:
4  enabled: false
5prometheus-pushgateway:
6  enabled: false
7prometheus-node-exporter:
8  enabled: false
9
10server:
11  service:
12    servicePort: 9090
helmfileでデプロイします。
1helmfile applyIstioのインストール
Istioのインストールをします。
1istioctl install --set profile=demo -ydefault Namespaceでサイドカーの有効化をします。
1kubectl label namespace default istio-injection=enabledデモアプリのデプロイ
次にデモアプリ用のDeployment、Service、Virtual Service、Gatewayをデプロイします。
deployment.yamlは下記の通りです。
1apiVersion: apps/v1
2kind: Deployment
3metadata:
4  name: nginx
5spec:
6  replicas: 1
7  selector:
8    matchLabels:
9      app: nginx
10  template:
11    metadata:
12      labels:
13        app: nginx
14    spec:
15      containers:
16      - image: nginx
17        name: nginx
18        ports:
19 - containerPort: 80service.yamlは下記の通りです。
1apiVersion: v1
2kind: Service
3metadata:
4  name: nginx-svc
5spec:
6  ports:
7  - protocol: TCP
8    name: http
9    port: 8080
10    targetPort: 80
11  selector:
12 app: nginxistio.yamlは下記の通りです。
1apiVersion: networking.istio.io/v1alpha3
2kind: Gateway
3metadata:
4  name: nginx-gateway
5spec:
6  selector:
7    istio: ingressgateway
8  servers:
9  - port:
10      number: 80
11      name: http
12      protocol: HTTP
13    hosts:
14    - "*"
15---
16apiVersion: networking.istio.io/v1alpha3
17kind: VirtualService
18metadata:
19  name: nginx
20spec:
21  hosts:
22  - "*"
23  gateways:
24  - nginx-gateway
25  http:
26  - route:
27    - destination:
28        host: nginx-svc
29        port:
30          number: 8080
それぞれデプロイします。
1kubectl apply -f deployment.yaml
2kubectl apply -f service.yaml
3kubectl apply -f istio.yaml
メトリクス確認の準備
Prometheus
まずはPrometheusにアクセスできるようにポートフォワードします。
1kubectl -n monitoring port-forward svc/prometheus-server 9090:9090これで、localhost:9090でPrometheusにアクセスできるようになりました。
デモアプリ
次にIstioのingressgateway経由でデモアプリにアクセスできるようにします。
まずはingressgatewayのポート番号を環境変数として設定します。
1export INGRESS_PORT=$(kubectl -n istio-system get service istio-ingressgateway -o jsonpath='{.spec.ports[?(@.name=="http2")].nodePort}')ボート番号を確認してみます。
1❯ echo $INGRESS_PORT
232333
設定した環境変数を使って、ポートフォワードします。
1kubectl -n istio-system port-forward svc/istio-ingressgateway $INGRESS_PORT:80これで、localhost:32333でデモアプリにアクセスできるようになりました。
メトリクスの確認
デモアプリにリクエストをいくつか送って、Prometheusからメトリクスを確認してみます。
まずは、いくつかデモアプリにリクエストを送ってみます。
1curl localhost:32333一気に送る場合は、下記を使うこともできます。
1for i in $(seq 1 100); do curl -s -o /dev/null "localhost:32333"; donePrometheusからistio_requests_totalを確認してみます。
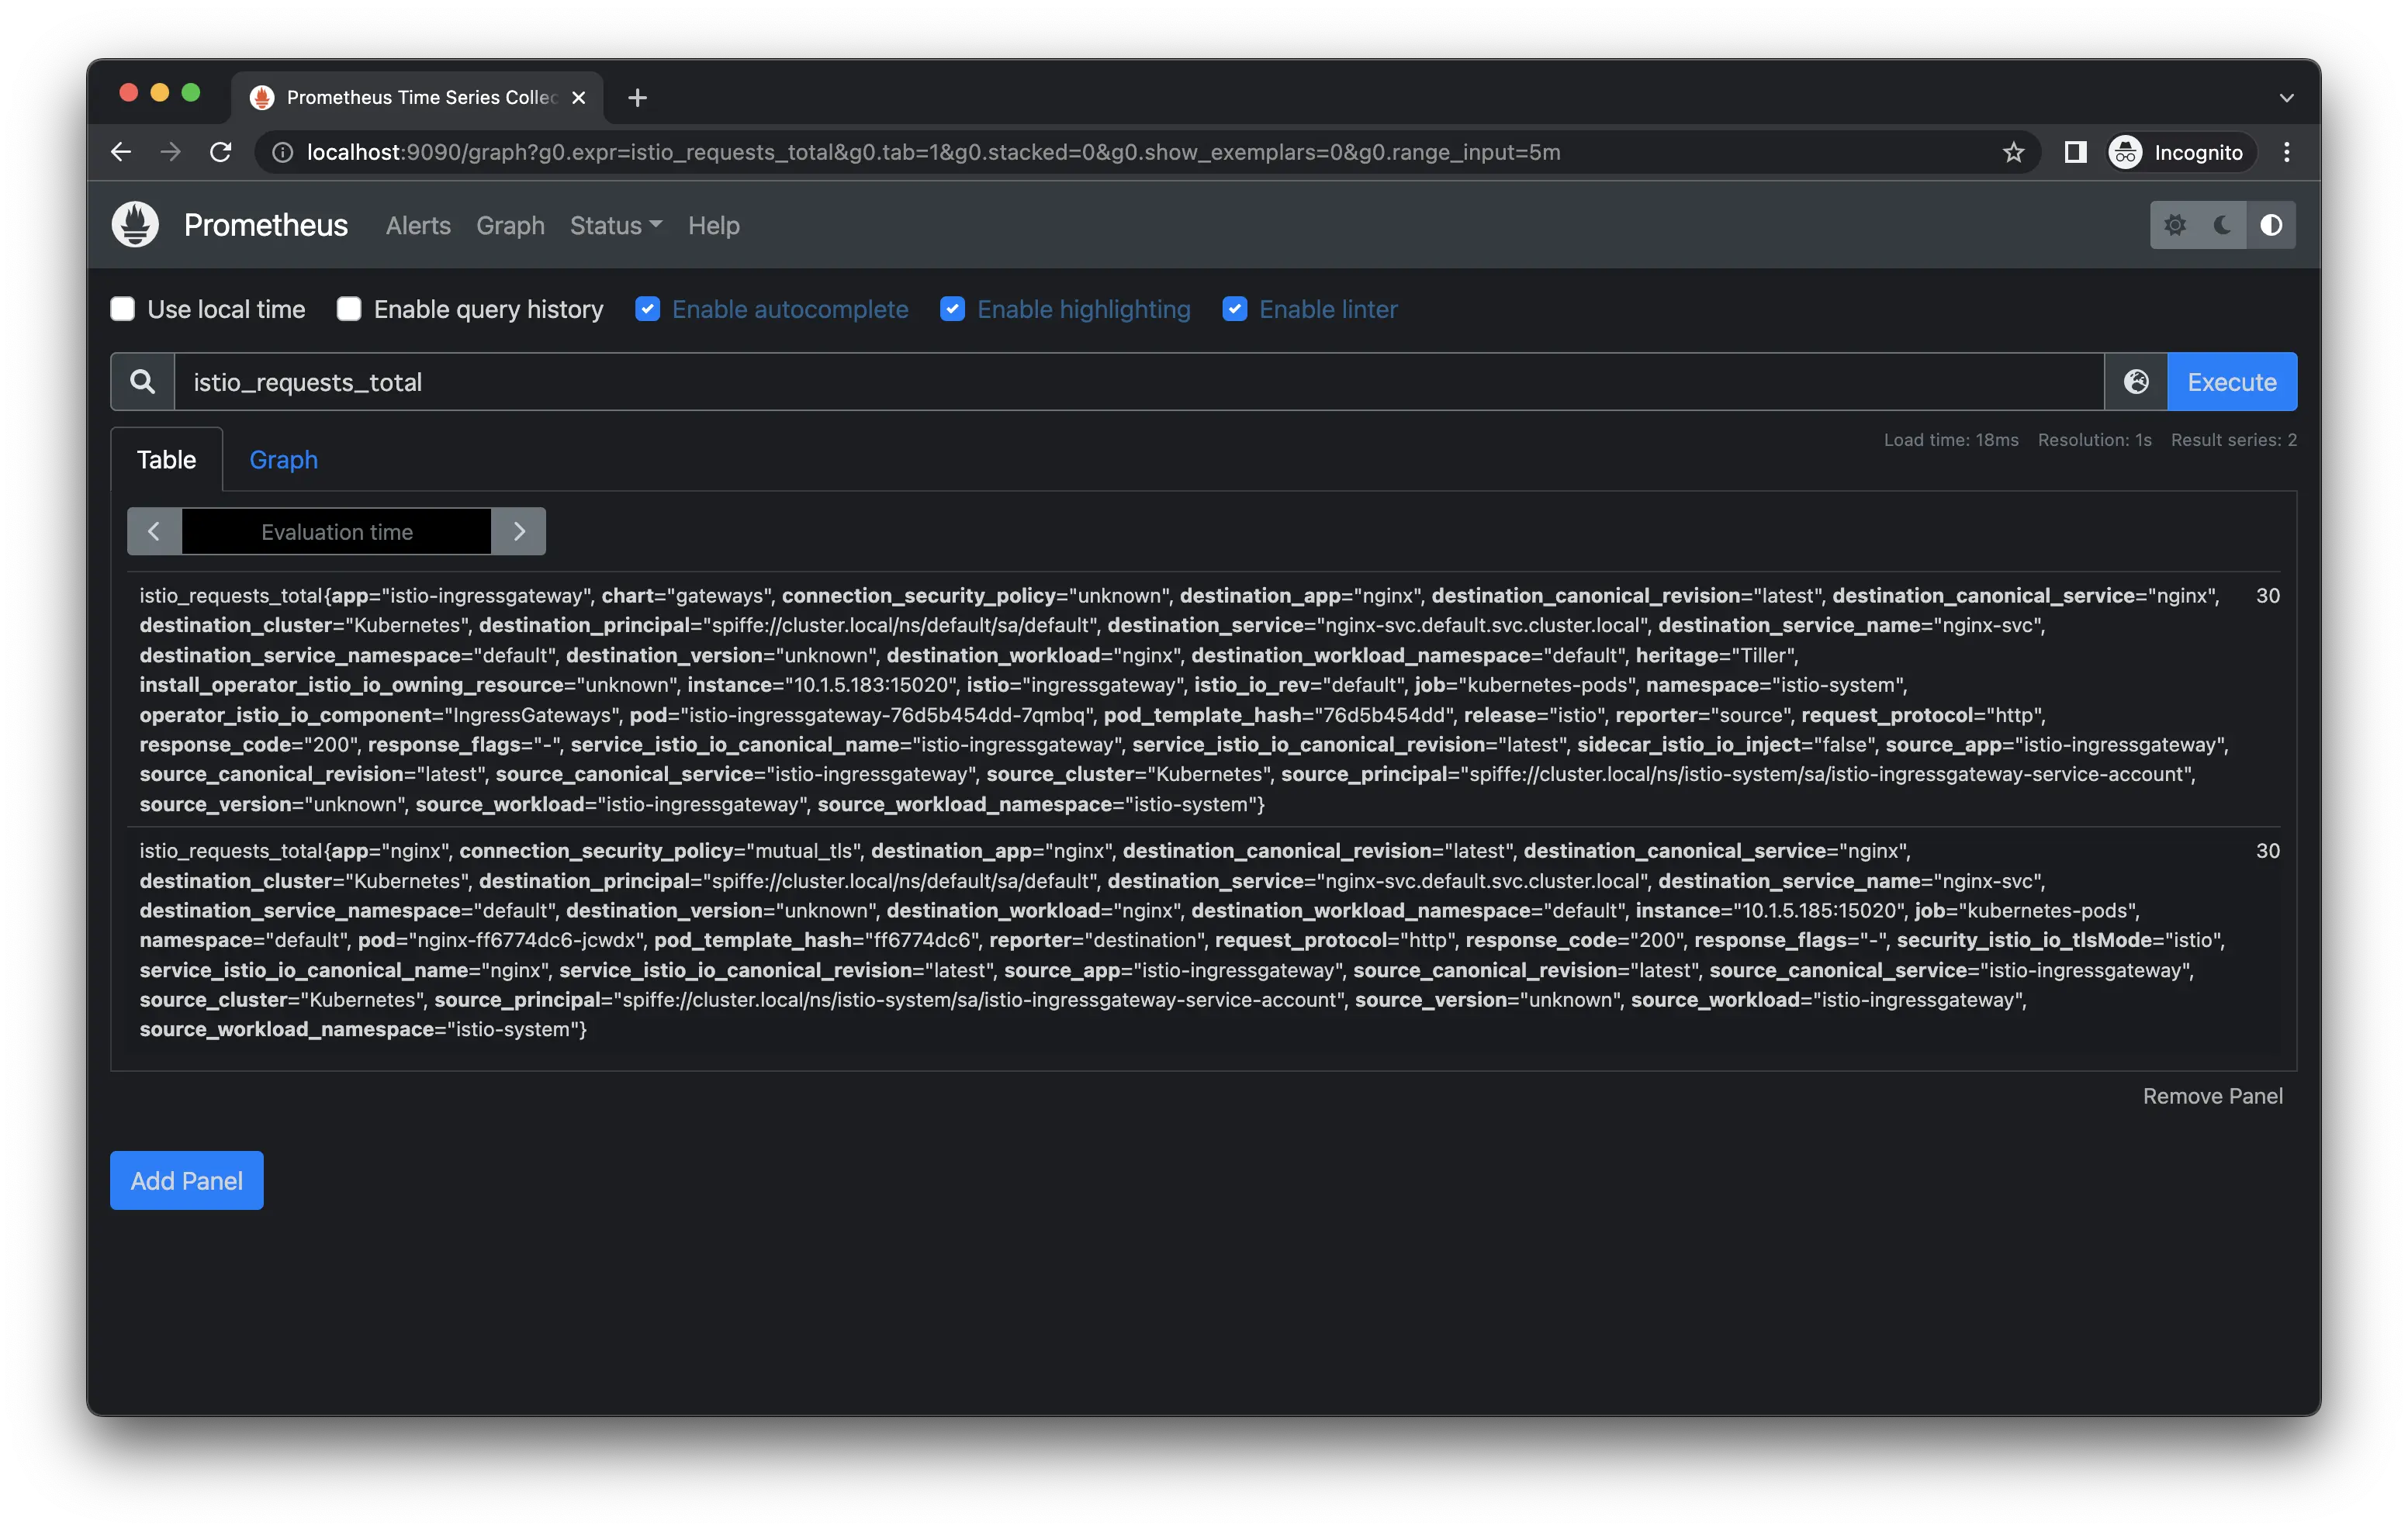
条件を絞って、確認することもできます。
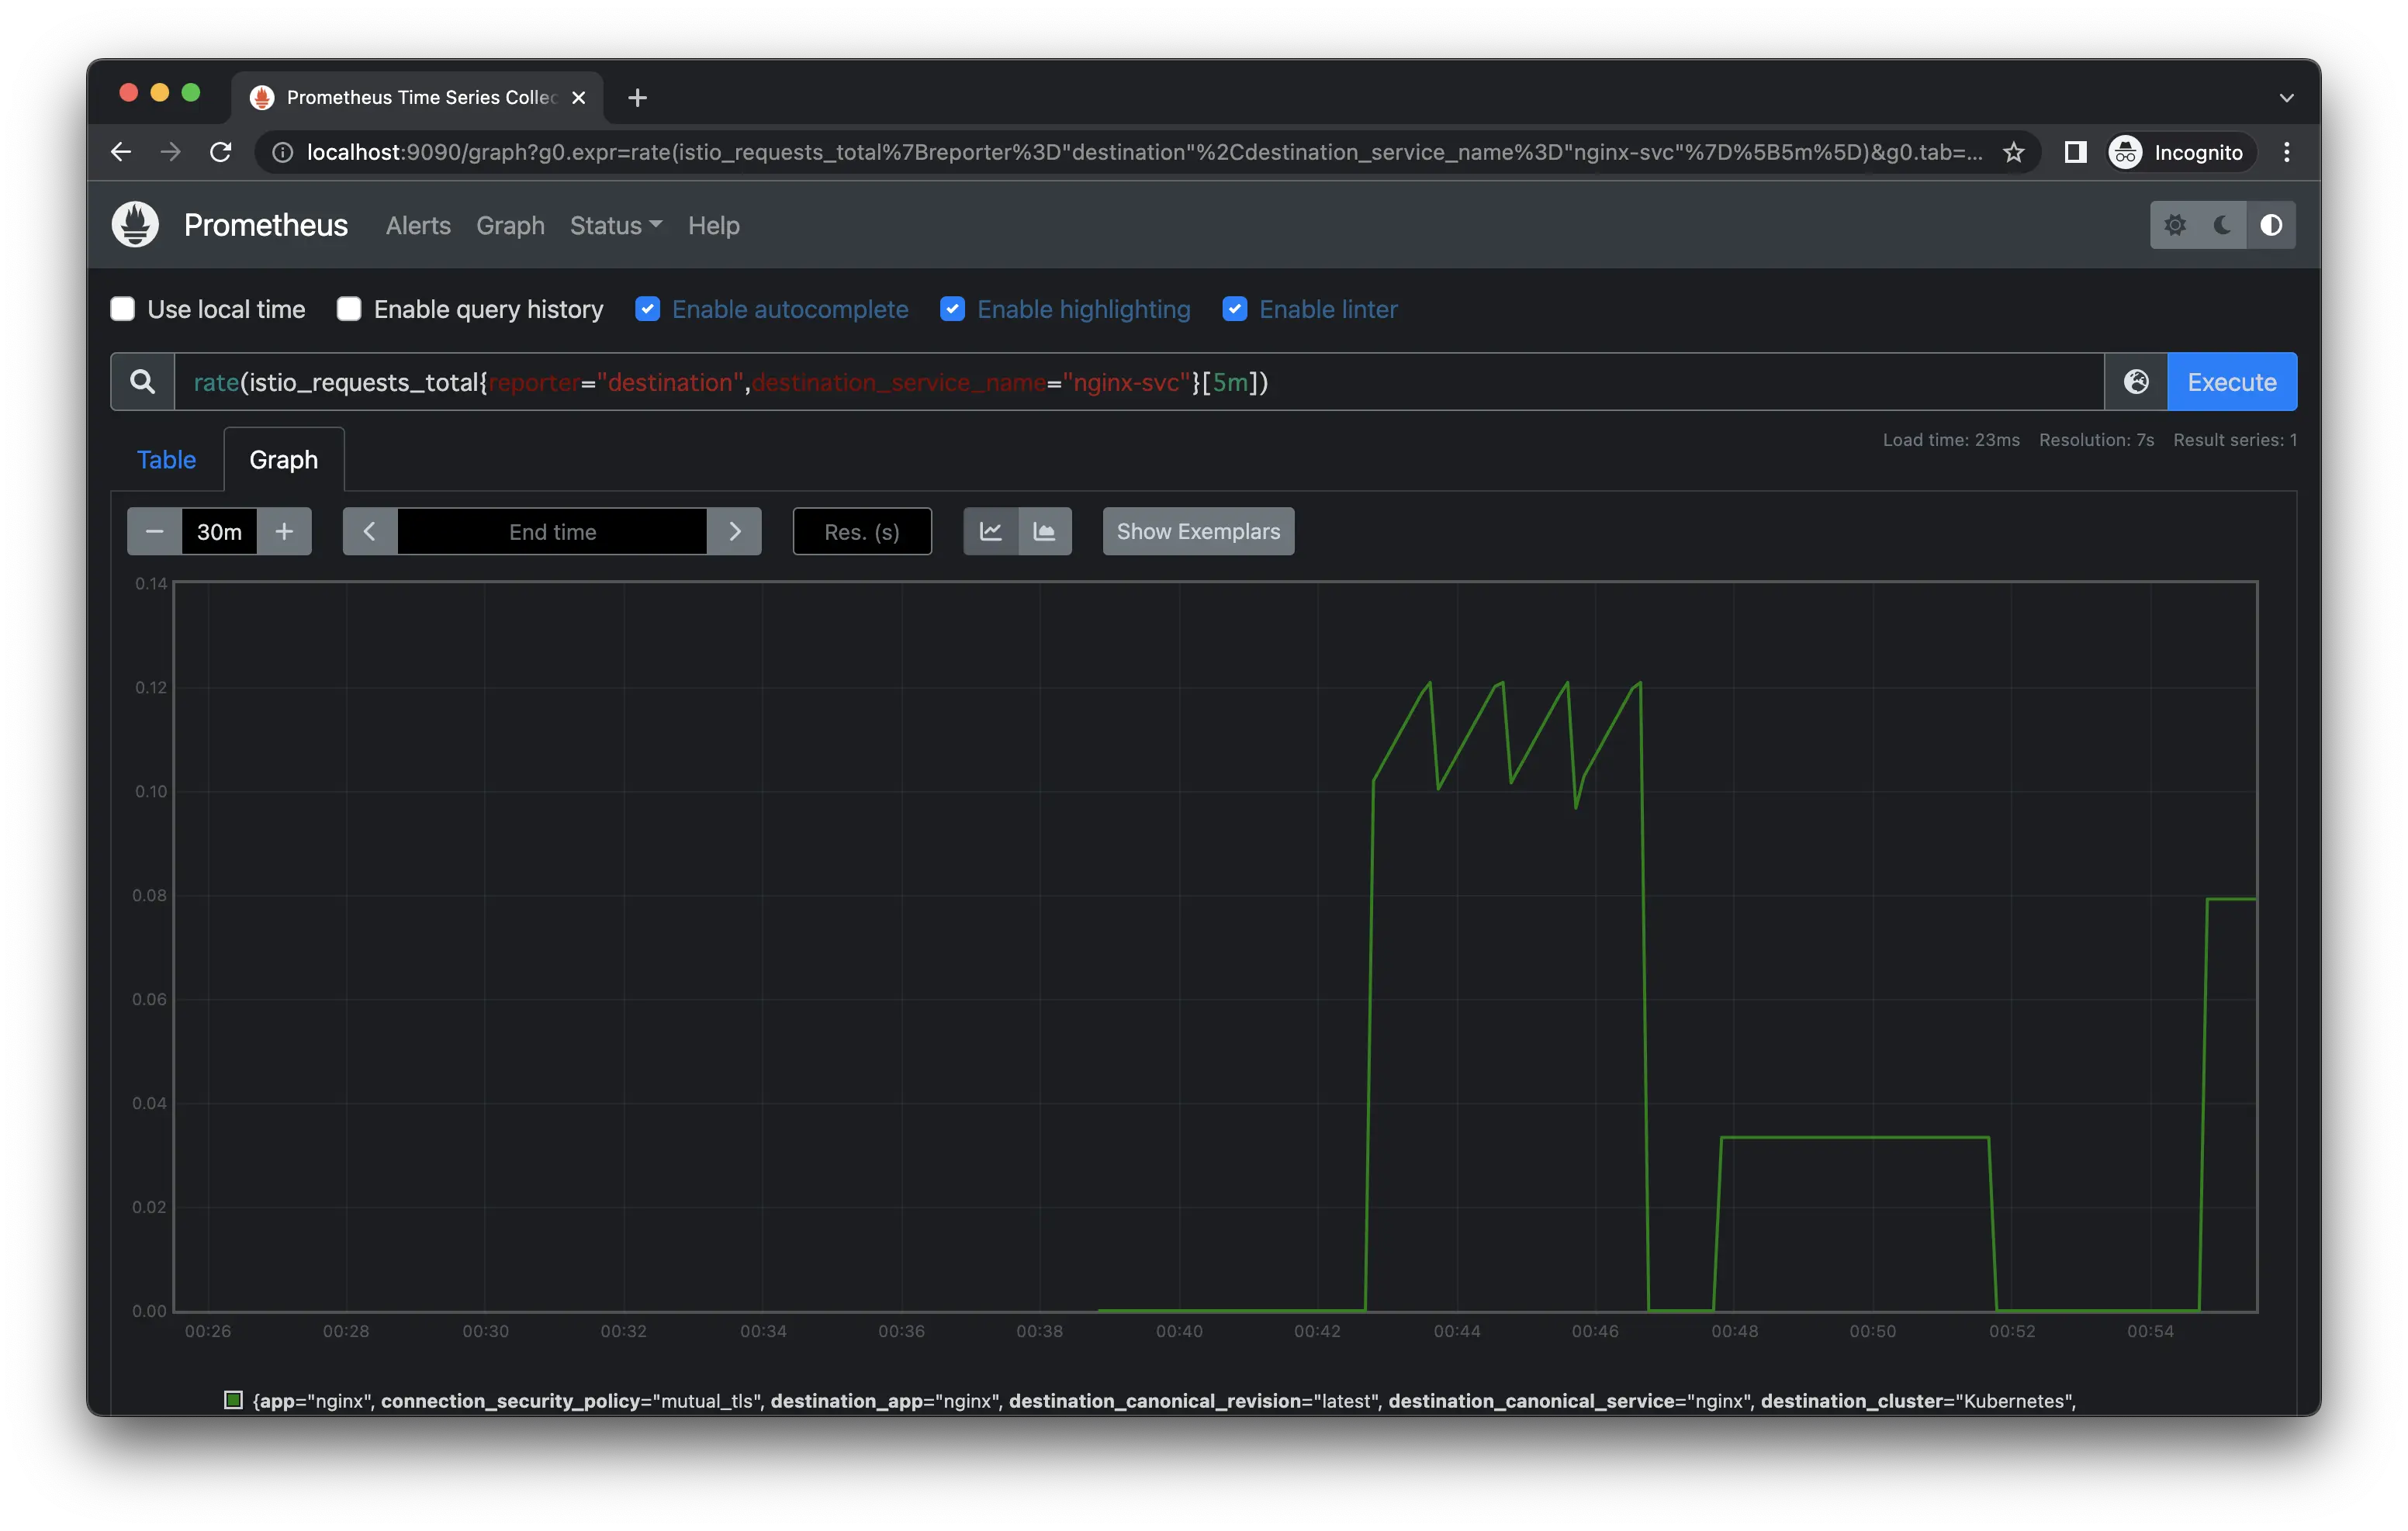
確認したPromQLは下記になります。
1rate(istio_requests_total{reporter="destination",destination_service_name="nginx-svc"}[5m])reporterは、destinationだとサーバ側のistio-proxyから、sourceだとクライアント側のistio-proxyもしくはgatewayからメトリクスを取得します。
参考
- Istio / Querying Metrics from Prometheus
- Istio / Istio Standard Metrics
- helm-charts/charts/prometheus at main · prometheus-community/helm-charts
- 【Helm】helmfileでPrometheusとGrafanaを構築する | amateur engineer's blog
- 【Istio】実際に動かしてざっくり理解するIstio | amateur engineer's blog

\ この記事が役に立ったと思ったら、サポートお願いします! /

関連記事

Cortexについて実際に動かしてざっくり理解する
【監視入門】とりあえず使ってみるPrometheus
【Prometheus】Alertmanagerをローカルで使ってみる