はじめに
Cortexについて簡単に紹介して、実際にローカルで動かしてみます。
Cortexとは
Cortexとは、Prometheusのための可用性が高い長期間ストレージです。
Prometheusのローカルストレージは長期保存には向かないため、長期間保存したい場合は、remote write APIを使ってCortexなどに保存する必要があります。
![]()
GitHub - cortexproject/cortex: A horizontally scalable, highly available, multi-tenant, long term Prometheus.
A horizontally scalable, highly available, multi-tenant, long term Prometheus. - cortexproject/cortex
Cortexは下記のような特徴があります。
- 水平スケール可能
- 高可用性
- Prometheusのマルチテナント対応
- 長期保存
アーキテクチャ
Cortexは複数のマイクロサービスから構成され、アーキテクチャは下記のようになっています。
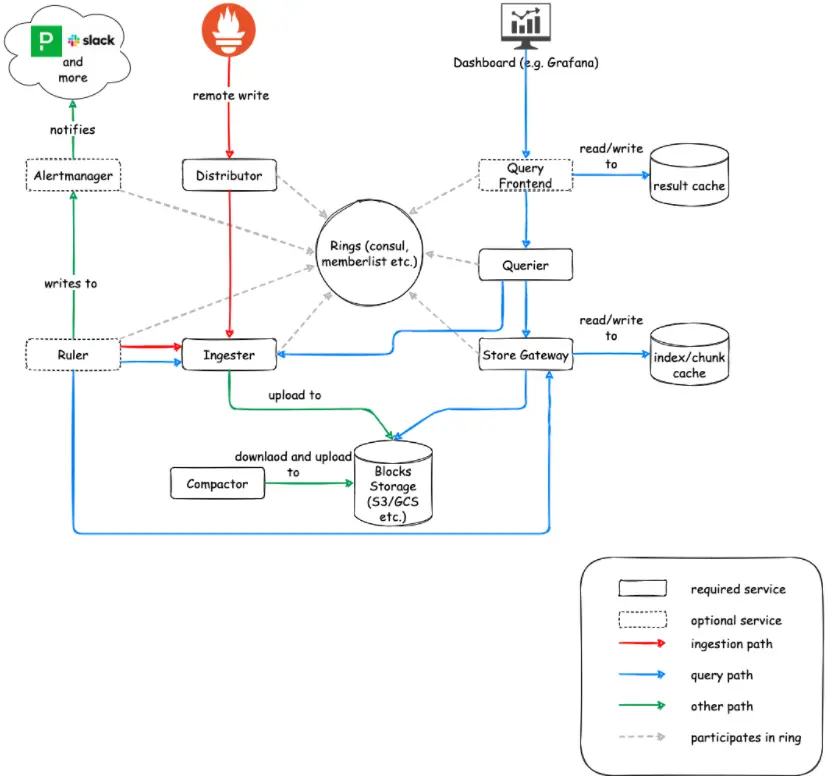 Cortexのドキュメントより
各サービス
各サービスをざっくり紹介します。
Distributor: Prometheusからのデータを処理Ingester: データを一時的に保持し長期保存ストレージに書き込むQuerier: PromQLを処理Compactor: ストレージのブロックをコンパクト化Store gateway: ブロックストレージにクエリを問い合わせるAlertmanager(optional): アラートを通知(PrometheusのAlertmanagerをベースに構築)Configs API(optional): RulerとAlertmanagerの設定を管理Overrides exporter(optional): Prometheusメトリクスを公開Query frontend(optional): QuerierのAPIのエンドポイントQuery scheduler(optional): Query frontendから内部キューを移動Ruler(optional): ルールやアラートを記録するPromQLを実行
Docker composeで試してみる
実際にDocker composeを使ってローカルで動かてみます。
作成するファイルは下記の通りです。
1.
2├── docker-compose.yml
3├── prometheus.yml
4└── single-process-config-blocks-local.yaml
docker-compose.yml
docker-compose.ymlは下記の通りです。Prometheus, Grafana, Node exporterそしてCortexのコンテナを起動するようにしています。
1version: '3'
2services:
3  prometheus:
4    image: prom/prometheus
5    volumes:
6      - ./prometheus.yml:/etc/prometheus/prometheus.yml
7    ports:
8      - '9090:9090'
9  grafana:
10    image: grafana/grafana
11    ports:
12      - "3000:3000"
13  node-exporter:
14    image: quay.io/prometheus/node-exporter
15    ports:
16      - 9100:9100
17    volumes:
18      - ./proc:/host/proc
19      - ./sys:/host/sys
20      - ./rootfs:/rootfs
21  cortex:
22    image: cortexproject/cortex:master-c0e4545
23    command: -config.file=/etc/single-process-config-blocks-local.yaml
24    ports:
25      - "9009:9009"
26    volumes:
27      - "./single-process-config-blocks-local.yaml:/etc/single-process-config-blocks-local.yaml"
Prometheusの設定
Prometheusの設定ファイル(prometheus.yml)を作成します。
下記の通りNode exporterからメトリクスを取得して、Cortexにremote writeで書き込むようにしています。
1global:
2  scrape_interval: 15s
3  external_labels:
4    monitor: 'codelab-monitor'
5scrape_configs:
6  - job_name: 'node'
7    scrape_interval: 5s
8    static_configs:
9      - targets: ['{node-exporter container name}:9100']
10remote_write:
11- url: http://{cortex container name}:9009/api/v1/push
Cortexの設定
Cortexの設定ファイルを作成します。
作成する内容は、公式が用意しているsingle-process-config-blocks-local.yamlを使用します。
cortex/docs/configuration/single-process-config-blocks-local.yaml at master · cortexproject/cortex
A horizontally scalable, highly available, multi-tenant, long term Prometheus. - cortexproject/cortex
1auth_enabled: false
2
3server:
4  http_listen_port: 9009
5
6  grpc_server_max_recv_msg_size: 104857600
7  grpc_server_max_send_msg_size: 104857600
8  grpc_server_max_concurrent_streams: 1000
9
10distributor:
11  shard_by_all_labels: true
12  pool:
13    health_check_ingesters: true
14
15ingester_client:
16  grpc_client_config:
17    max_recv_msg_size: 104857600
18    max_send_msg_size: 104857600
19    grpc_compression: gzip
20
21ingester:
22  lifecycler:
23    min_ready_duration: 0s
24    final_sleep: 0s
25    num_tokens: 512
26
27    ring:
28      kvstore:
29        store: inmemory
30      replication_factor: 1
31
32blocks_storage:
33  tsdb:
34    dir: /tmp/cortex/tsdb
35
36  bucket_store:
37    sync_dir: /tmp/cortex/tsdb-sync
38
39  backend: filesystem # s3, gcs, azure or filesystem are valid options
40
41  filesystem:
42    dir: ./data/tsdb
43
44compactor:
45  data_dir: /tmp/cortex/compactor
46  sharding_ring:
47    kvstore:
48      store: inmemory
49
50frontend_worker:
51  match_max_concurrent: true
52
53ruler:
54  enable_api: true
55
56ruler_storage:
57  backend: local
58  local:
59    directory: /tmp/cortex/rules
コンテナの起動
Docker composeでコンテナを起動します。
1docker compose up -d動作確認
Prometheusのコンテナのログを確認すると、Cortexに書き込んでいることがわかります。
1❯ docker container logs prometheus-grafana-cortex-prometheus-1
2ts=2023-01-10T12:48:58.381Z caller=main.go:491 level=info msg="No time or size retention was set so using the default time retention" duration=15d
3ts=2023-01-10T12:48:58.381Z caller=main.go:535 level=info msg="Starting Prometheus Server" mode=server version="(version=2.37.1, branch=HEAD, revision=1ce2197e7f9e95089bfb95cb61762b5a89a8c0da)"
4ts=2023-01-10T12:48:58.381Z caller=main.go:540 level=info build_context="(go=go1.18.6, user=root@3caaaea7ba87, date=20220912-12:42:39)"
5ts=2023-01-10T12:48:58.381Z caller=main.go:541 level=info host_details="(Linux 5.15.49-linuxkit #1 SMP Tue Sep 13 07:51:46 UTC 2022 x86_64 92d5e53c4e7f (none))"
6ts=2023-01-10T12:48:58.381Z caller=main.go:542 level=info fd_limits="(soft=1048576, hard=1048576)"
7ts=2023-01-10T12:48:58.381Z caller=main.go:543 level=info vm_limits="(soft=unlimited, hard=unlimited)"
8ts=2023-01-10T12:48:58.385Z caller=web.go:553 level=info component=web msg="Start listening for connections" address=0.0.0.0:9090
9ts=2023-01-10T12:48:58.392Z caller=main.go:972 level=info msg="Starting TSDB ..."
10ts=2023-01-10T12:48:58.394Z caller=tls_config.go:195 level=info component=web msg="TLS is disabled." http2=false
11ts=2023-01-10T12:48:58.429Z caller=head.go:493 level=info component=tsdb msg="Replaying on-disk memory mappable chunks if any"
12ts=2023-01-10T12:48:58.430Z caller=head.go:536 level=info component=tsdb msg="On-disk memory mappable chunks replay completed" duration=5.956µs
13ts=2023-01-10T12:48:58.430Z caller=head.go:542 level=info component=tsdb msg="Replaying WAL, this may take a while"
14ts=2023-01-10T12:48:58.431Z caller=head.go:613 level=info component=tsdb msg="WAL segment loaded" segment=0 maxSegment=0
15ts=2023-01-10T12:48:58.431Z caller=head.go:619 level=info component=tsdb msg="WAL replay completed" checkpoint_replay_duration=48.061µs wal_replay_duration=1.325947ms total_replay_duration=1.410066ms
16ts=2023-01-10T12:48:58.435Z caller=main.go:993 level=info fs_type=EXT4_SUPER_MAGIC
17ts=2023-01-10T12:48:58.435Z caller=main.go:996 level=info msg="TSDB started"
18ts=2023-01-10T12:48:58.435Z caller=main.go:1177 level=info msg="Loading configuration file" filename=/etc/prometheus/prometheus.yml
19ts=2023-01-10T12:48:58.448Z caller=dedupe.go:112 component=remote level=info remote_name=752f9f url=http://prometheus-grafana-cortex-cortex-1:9009/api/v1/push msg="Starting WAL watcher" queue=752f9f
20ts=2023-01-10T12:48:58.449Z caller=dedupe.go:112 component=remote level=info remote_name=752f9f url=http://prometheus-grafana-cortex-cortex-1:9009/api/v1/push msg="Starting scraped metadata watcher"
21ts=2023-01-10T12:48:58.449Z caller=dedupe.go:112 component=remote level=info remote_name=752f9f url=http://prometheus-grafana-cortex-cortex-1:9009/api/v1/push msg="Replaying WAL" queue=752f9f
22ts=2023-01-10T12:48:58.456Z caller=main.go:1214 level=info msg="Completed loading of configuration file" filename=/etc/prometheus/prometheus.yml totalDuration=20.453165ms db_storage=2.472µs remote_storage=3.700617ms web_handler=1.128µs query_engine=2.292µs scrape=6.012476ms scrape_sd=55.72µs notify=2.065µs notify_sd=2.781µs rules=2.567µs tracing=10.343µs
23ts=2023-01-10T12:48:58.457Z caller=main.go:957 level=info msg="Server is ready to receive web requests."
24ts=2023-01-10T12:48:58.458Z caller=manager.go:941 level=info component="rule manager" msg="Starting rule manager..."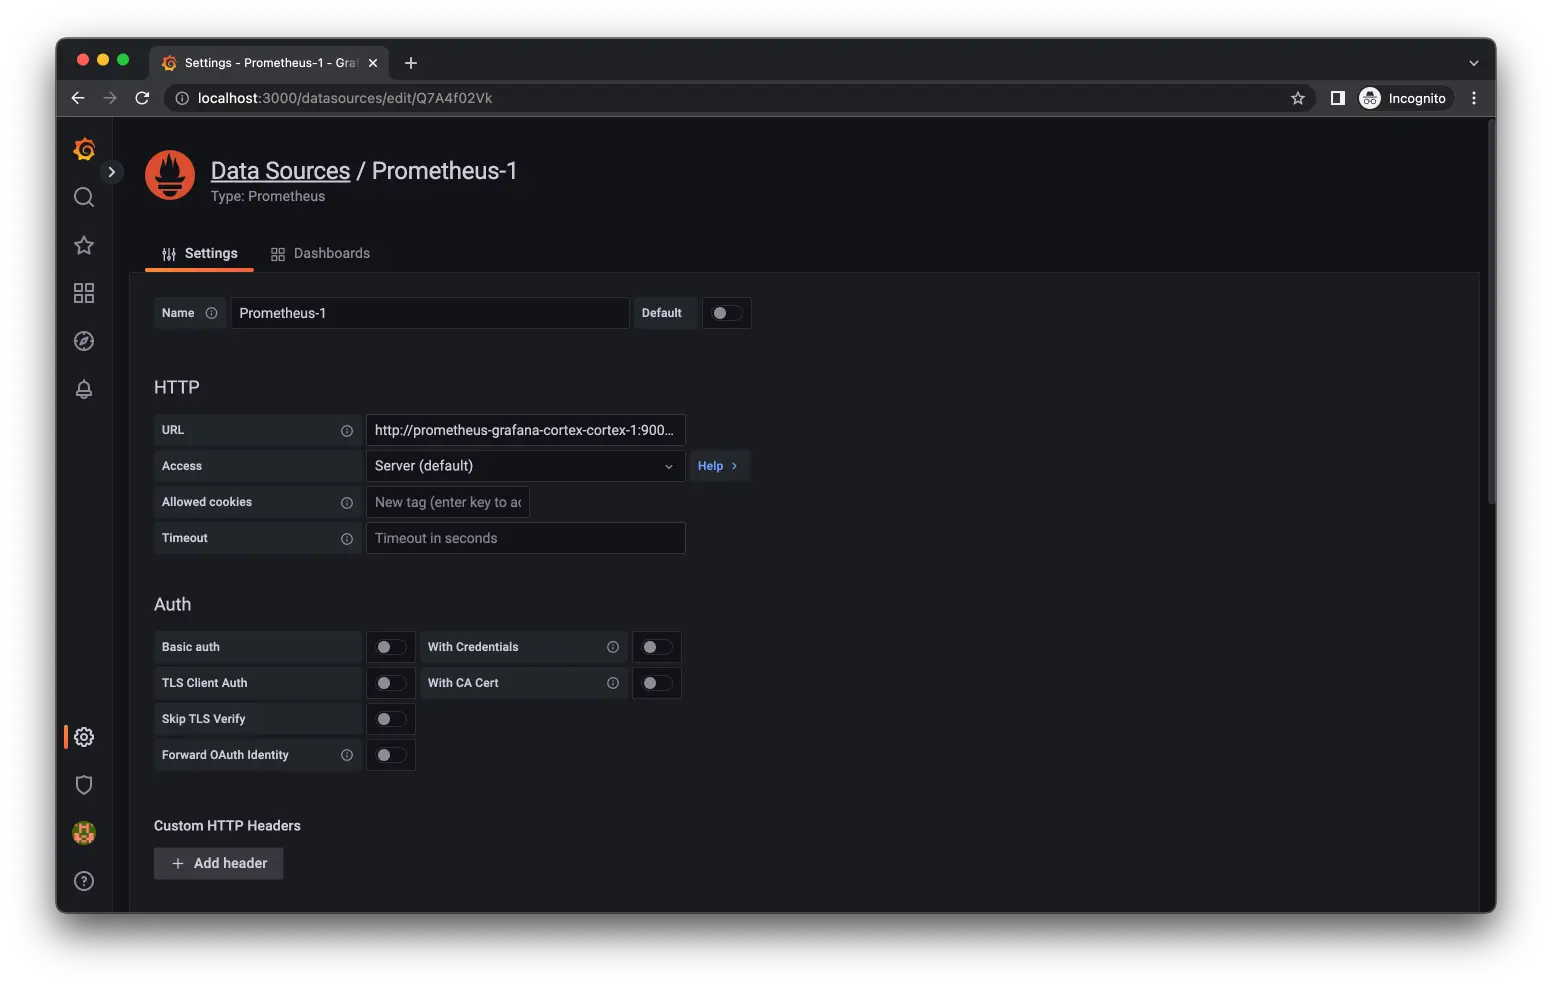
25ts=2023-01-10T12:49:05.042Z caller=dedupe.go:112 component=remote level=info remote_name=752f9f url=http://prometheus-grafana-cortex-cortex-1:9009/api/v1/push msg="Done replaying WAL" duration=6.593108321sGrafanaからhttp://{cortex container name}:9009/prometheusを指定することで、Cortex用のDataa Sourceを作成することができます。
参考
- Cortex
- Documentation | Cortex
- cortexproject/cortex: A horizontally scalable, highly available, multi-tenant, long term Prometheus.
\ この記事が役に立ったと思ったら、サポートお願いします! /

関連記事
【Senryでエラー監視】Pythonのエラーを確認してみる
【Prometheus】ローカルでPromxyを動かしながら理解する
ローカルでPrometheusとGrafanaでダッシュボード作成してみる